Back to Edexcel Linear Graphs (F) Home
Linear Graphs: Quiz 4 - Answers
Linear Graphs: Quiz 4 - Answers
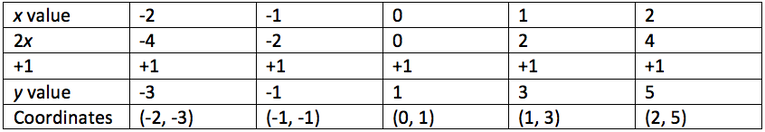
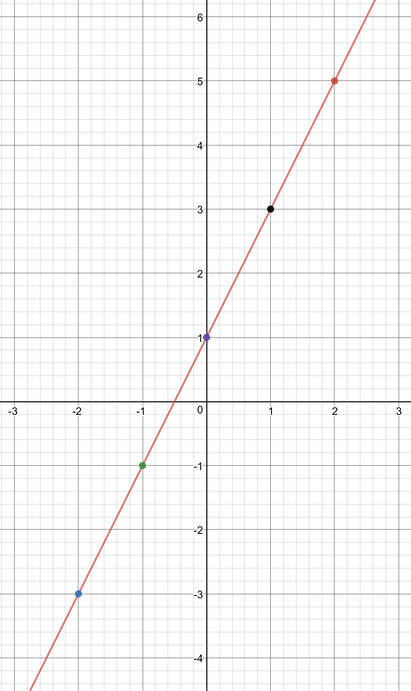
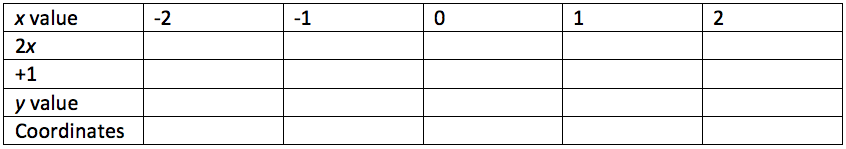
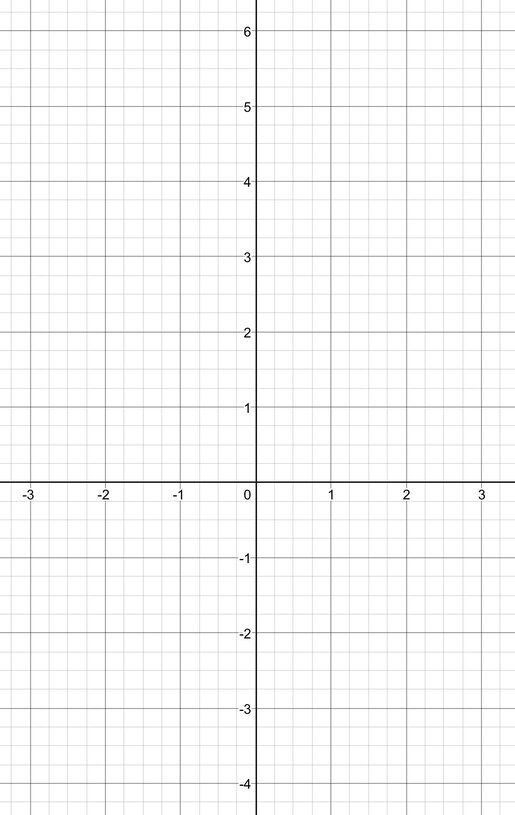
1) y = 2x + 1
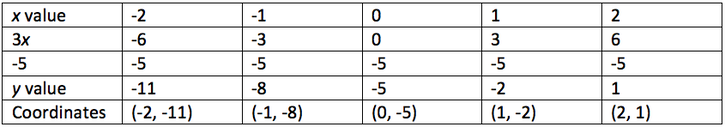
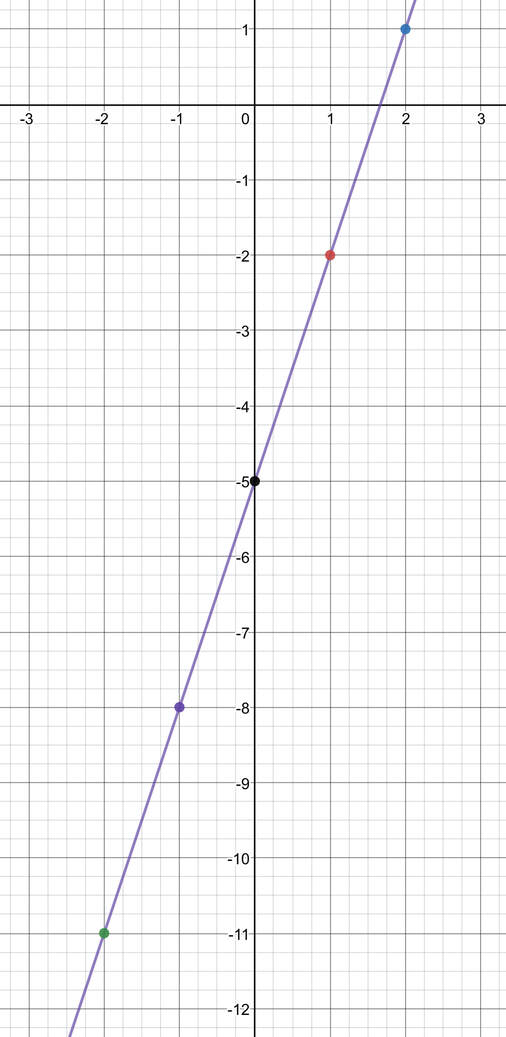
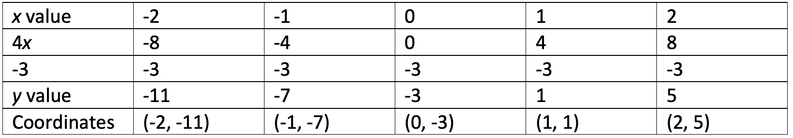
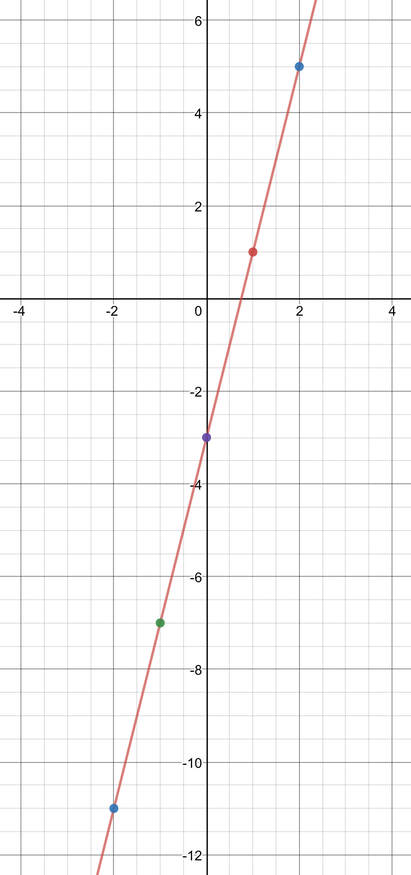
2) y = 3x – 5
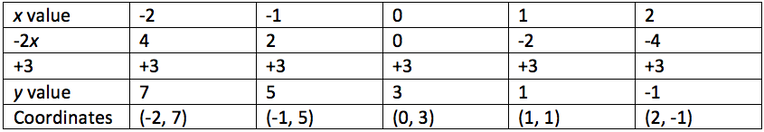
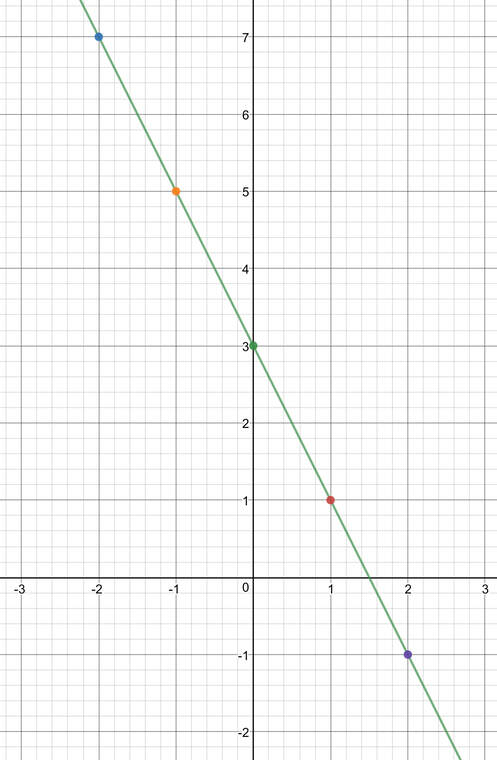
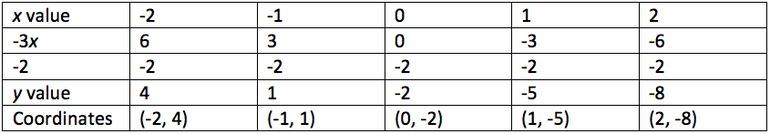
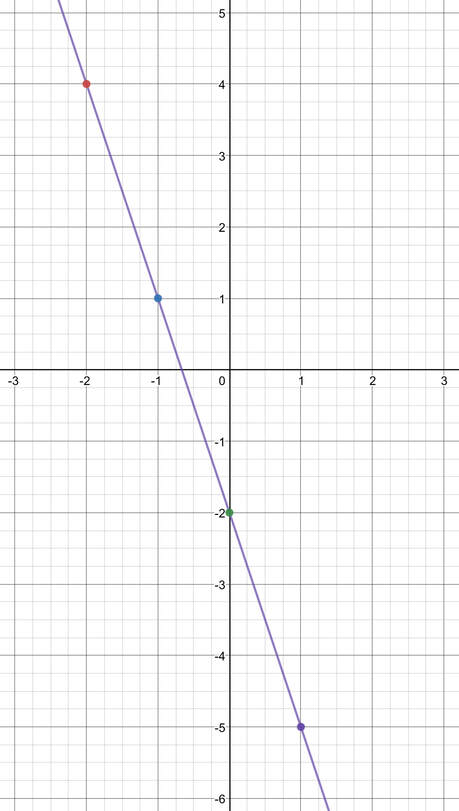
3) y = -2x + 3
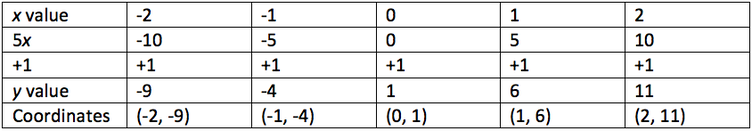
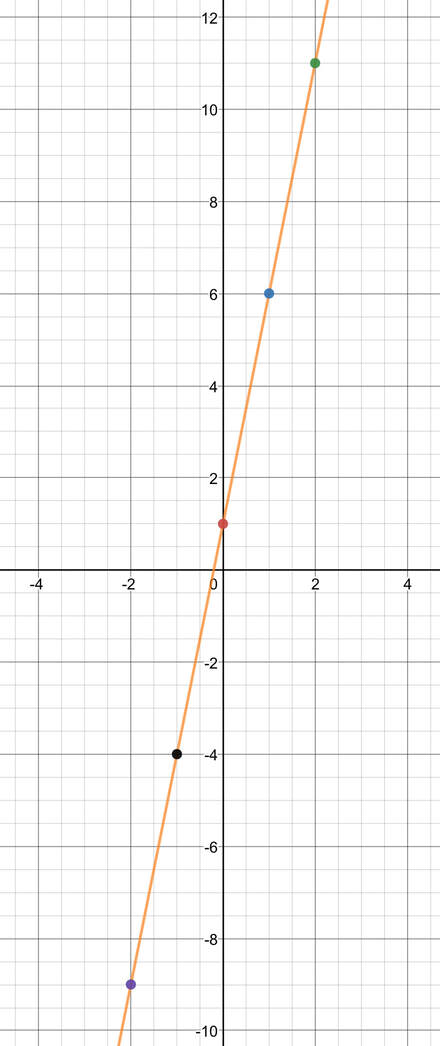
4) y = 5x + 1
5) y = -3x – 2
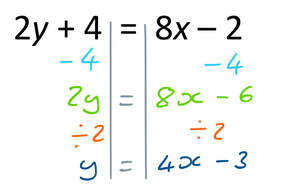
6)
There is no working for this quiz.
Questions
Click here for a printable version of the graphs for this quiz.
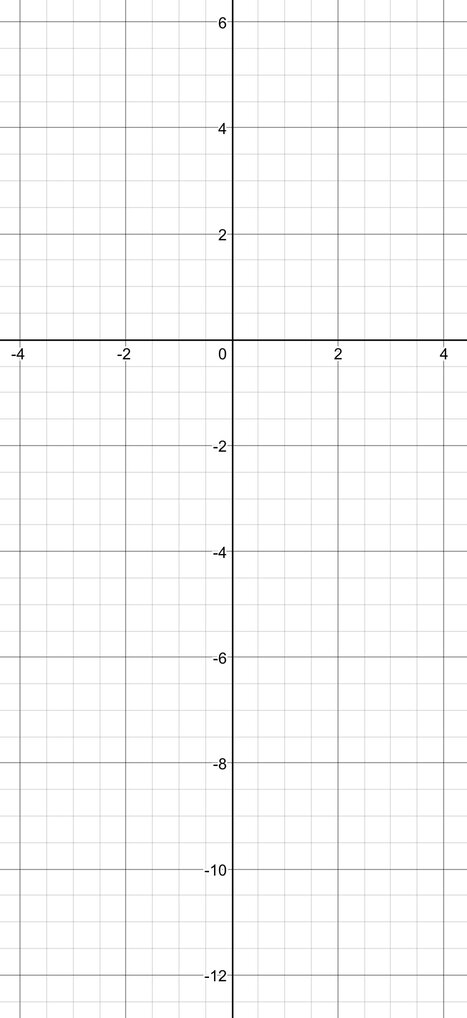
1) Use the table below to help you plot the graph y = 2x +1 for the values of x between -2 and 2.
Click here for a printable version of the graphs for this quiz.
1) Use the table below to help you plot the graph y = 2x +1 for the values of x between -2 and 2.
2) Use the table below to help you plot the graph y = 3x – 5 for the x values between -2 and 2.

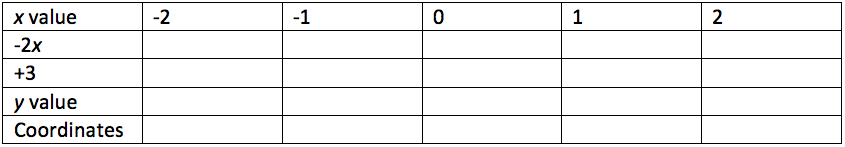
3) Use the table below to help you plot the graph y = -2x + 3 for the x values between -2 and 2.
4) Plot the graph of y = 5x + 1. Create your own table and use x values between -2 and 2.
5) Plot the graph of y = -3x – 2. Create your own table and use x values between -2 and 2.
6) Plot the graph of 2y + 4 = 8x – 2. Create your own table and use x values between -2 and 2. Hint: get the graph into the form y = mx + c