Back to Edexcel Representing Data (F) Home
6.2 C) Bar Chart – Part 2
6.2 C) Bar Chart – Part 2
Working out the Mean from Bar Charts
In the analysing data section (6.3) we look at the four different averages; mean, mode, median and range. In this section we are going to be looking at working out the mean from bar charts. You may find it useful to work through some or all of the content in the analysing data section (6.3) before working through the content in this section (click here if you would like to be taken to section 6.3).
We obtain the mean by adding up all of the numbers in the data set and dividing by the number of observations/ values in the data set. The formula for working out the mean is shown below:

We are now going to have a look at working out the mean from bar charts.
Example 1
The bar chart below shows the number of times that individuals exercise per week.
The bar chart below shows the number of times that individuals exercise per week.
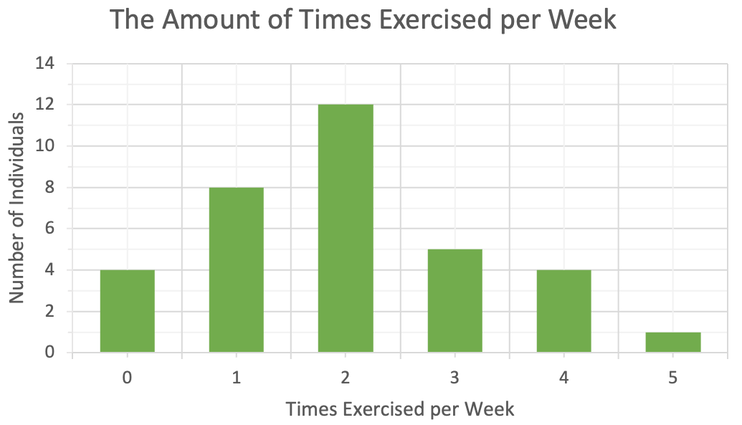
Work out the mean for the number of times that people exercise per week.
The formula for working out the mean is shown below.
The formula for working out the mean is shown below.

In order to work out the mean, we need to know two pieces of information:
I am going to work out the total number of observations/ people asked first. We are able to do this by adding up the frequencies of the different bars. We work out the frequencies of the different bars by looking at the top of the bars and reading across to the y axis. I have added the frequencies for each of the bars on the graph below.
- The total number of exercise sessions completed (this is the sum of all of the values)
- The number of observations/ values/ people asked
I am going to work out the total number of observations/ people asked first. We are able to do this by adding up the frequencies of the different bars. We work out the frequencies of the different bars by looking at the top of the bars and reading across to the y axis. I have added the frequencies for each of the bars on the graph below.
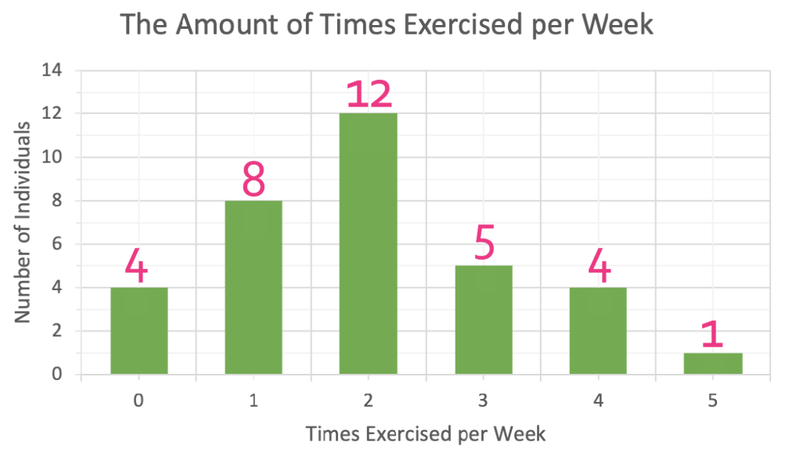
We now need to add all of these frequencies together to work out the total number of observations/ people asked.

From the calculation above, we can see that the number of values is 34.
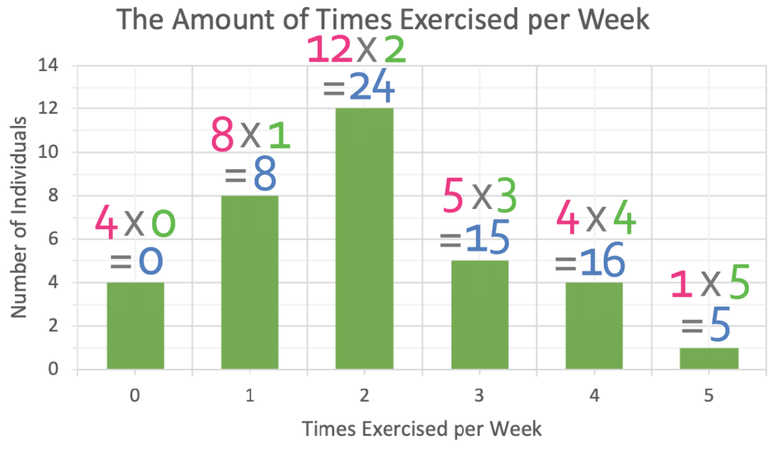
We now need to work out the total number of exercise sessions that were undertaken by these 34 people. We work this out by working out the total number of sessions for each of the bars and then we add the total number of sessions from all of the bars together. We work out the total number of sessions completed for each bar by multiplying the frequency by the number of session that the bar represents.
Let’s work out the total number of sessions for the third bar from the left. The third bar is representing individuals that do 2 exercise sessions per week. This bar has a frequency of 12. We work out the total number of sessions completed for this bar by multiplying the frequency (12) by the number of sessions that the bar represents (2). This means that the total number of exercise sessions that come from the third bar is 24 (12 x 2).
We do the same for all of the other bars and the working for this is shown on the bar chart below.
The next step is to add the number of sessions for each of the bars together.
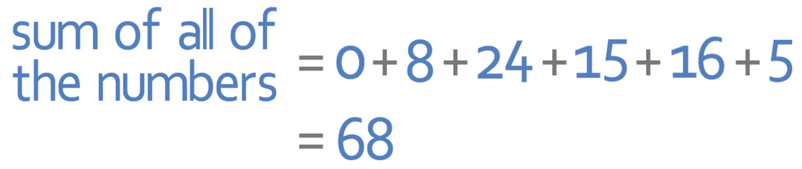
There are 68 sessions completed.
We now have everything we need to work out the mean; we know that the total number of sessions completed is 68 and the number of individuals is 34. We sub these values into the mean formula to obtain the mean.
We now have everything we need to work out the mean; we know that the total number of sessions completed is 68 and the number of individuals is 34. We sub these values into the mean formula to obtain the mean.
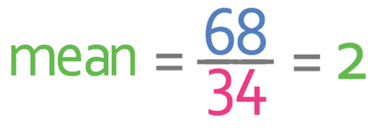
The mean number of times exercised per week is 2.
Example 2
We are now going to have a look at an example of finding the mean from a bar chart where we have grouped data. We answer these types of questions in pretty much the same way. The only difference is that we work out the totals from each of the bars by multiplying the frequency by the midpoint of the group that the bar represents. This will all make sense after we have looked at an example. Questions about finding the mean from bar charts when grouped data is involved will say “estimate the mean” and not “find the mean”. They say “estimate” rather than “find” because the data is grouped, thus meaning that we do not have the exact values and therefore we cannot say for certain what the mean is.
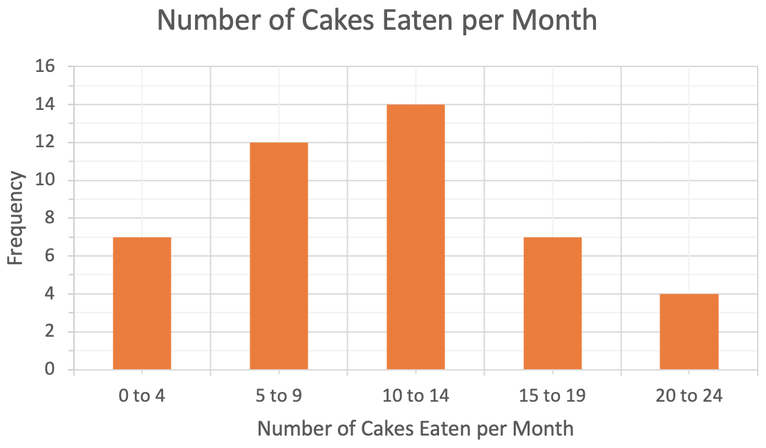
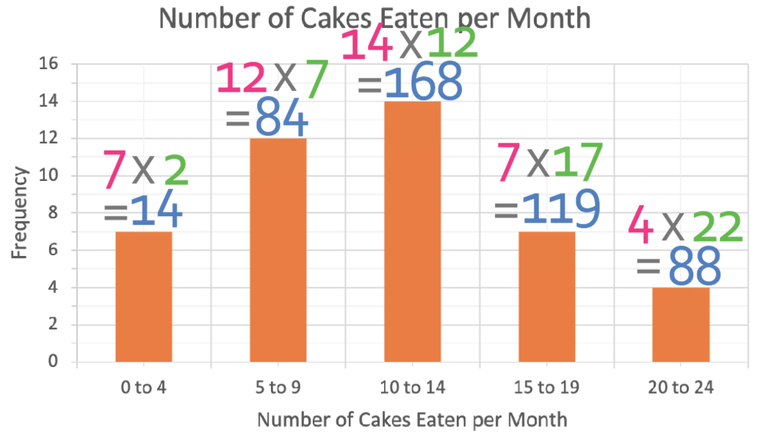
The bar chart below shows the number of cakes eaten per month for a group of students. Estimate the mean number of cakes eaten per month.
We are now going to have a look at an example of finding the mean from a bar chart where we have grouped data. We answer these types of questions in pretty much the same way. The only difference is that we work out the totals from each of the bars by multiplying the frequency by the midpoint of the group that the bar represents. This will all make sense after we have looked at an example. Questions about finding the mean from bar charts when grouped data is involved will say “estimate the mean” and not “find the mean”. They say “estimate” rather than “find” because the data is grouped, thus meaning that we do not have the exact values and therefore we cannot say for certain what the mean is.
The bar chart below shows the number of cakes eaten per month for a group of students. Estimate the mean number of cakes eaten per month.
The formula for working out the mean is:

In order to work out the mean, we will divide the total number of cakes eaten by the number of individuals. We are able to work out the number of individuals by adding up the frequencies for each of the bars. I have added the frequencies for each of the bars on the graph below.
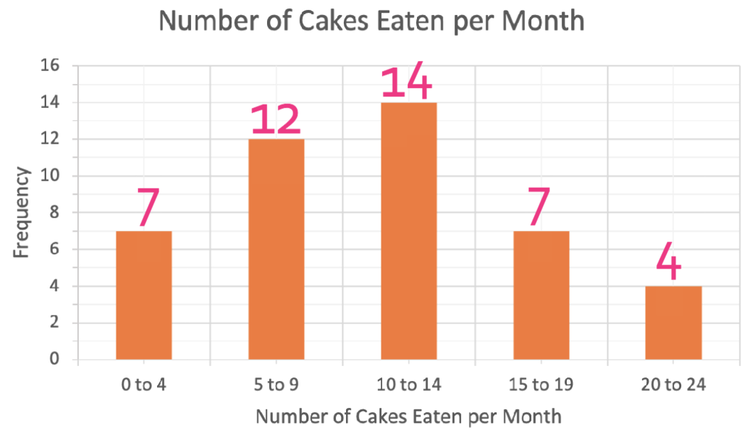
We now add the frequencies for each of the bars together.
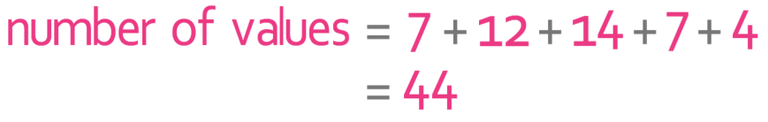
The number of individuals is 44.
We now need to work out the total number of cakes eaten by all of the 44 students. We work this out by finding the number of cakes eaten for each of the bars, and then we add all of the bars together. We work out the total number of cakes eaten for each of the bars by multiplying the frequency by the number of cakes that the bar represents.
Let’s start by working out the number of cakes eaten for the first bar. The first bar represents 0 to 4 cakes and it has a frequency of 7. The number of cakes eaten is grouped (0 to 4). This means that we need to find the midpoint of the group before we can work out an estimate for the number of cakes eaten for that bar. You can work out the midpoint of 0 to 4 by either spotting it or by adding the start and end of the group together and dividing by 2. Therefore, the midpoint of 0 to 4 is 2. We now multiply the frequency (7) by the midpoint (2) to obtain an estimate for the number of cakes eaten for this bar. Our estimate is 14 (7 x 2).
We do the same for all of the other bars and the working is shown below.
The next step is to add the number of cakes eaten for each of the bars together.
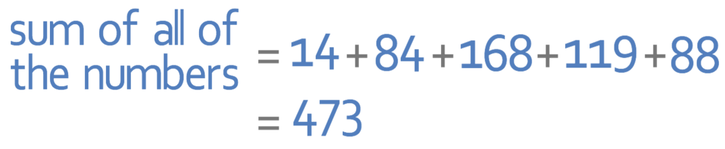
This tells us that an estimate for the total number of cakes eaten is 473.
We now have everything we need to work out the mean; we know that the total number of cakes eaten is 473 and the number of students is 44. We sub these values into the mean formula.
We now have everything we need to work out the mean; we know that the total number of cakes eaten is 473 and the number of students is 44. We sub these values into the mean formula.

An estimate for the mean number of cakes eaten in a month is 10.75.
End Note
It may be the case that you are asked to work out the mean from a frequency polygon. We are able to find the mean from a frequency polygon in exactly the same way that we have found the mean from a bar chart. There are a couple of questions in the quiz that ask you to find the mean from a frequency polygon.
It may be the case that you are asked to work out the mean from a frequency polygon. We are able to find the mean from a frequency polygon in exactly the same way that we have found the mean from a bar chart. There are a couple of questions in the quiz that ask you to find the mean from a frequency polygon.