Back to Edexcel Representing Data (F) Home
6.2 E) Pictograms
6.2 E) Pictograms
Pictograms use pictures to show frequencies. Pictograms must have a key, so we know how much one full picture represents. Pictograms can also have parts of pictures and we use the key to find out how much the part of the picture that we are given represents. We find the frequency for a particular category by adding up the frequencies for the full pictures and the frequency for the parts of pictures together. We will be doing this in example 1.
Number of Pictures
We are able to find out how many full pictures and parts of pictures we need for a particular category by dividing the frequency for that category by the amount that one picture represents. The formula is shown below:
Number of Pictures
We are able to find out how many full pictures and parts of pictures we need for a particular category by dividing the frequency for that category by the amount that one picture represents. The formula is shown below:

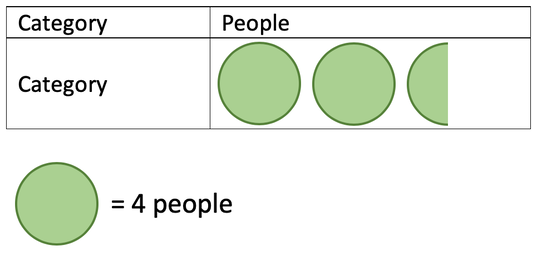
Let’s suppose that we are using a picture of a ball and each full ball represents 4 people. A category has a frequency of 10. How would we represent this using pictures/ balls?
We are told that one ball represents a frequency of 4 and the frequency of our group is 10. We can sub these values into the formula below.
We are told that one ball represents a frequency of 4 and the frequency of our group is 10. We can sub these values into the formula below.
This tells us that we need 2 full balls and half a ball (the two full balls represent a total frequency of 8 [there are 2 balls each with a frequency of 4, so 2 x 4 = 8] and half a ball represent 2. This is how we get a total frequency of 10 [8 + 2 = 10]). The pictogram is shown below:
Example 1 – Interpreting a Pictogram
The pictogram below shows the favourite chocolate bar of 18 pupils. What are the frequencies for the pictogram below?
The pictogram below shows the favourite chocolate bar of 18 pupils. What are the frequencies for the pictogram below?
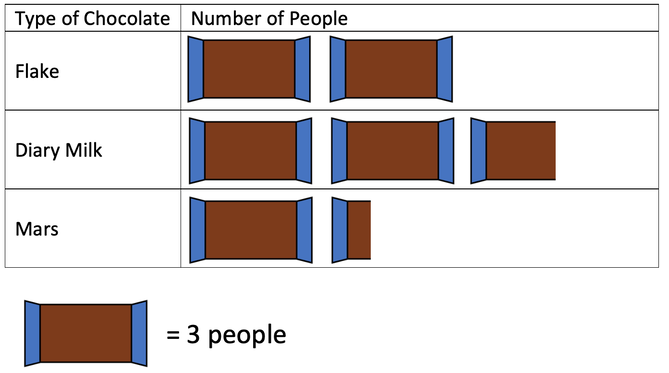
From the key, we can see that one chocolate bar represents 3 people. We can use the key to find out the frequencies for each of the categories.
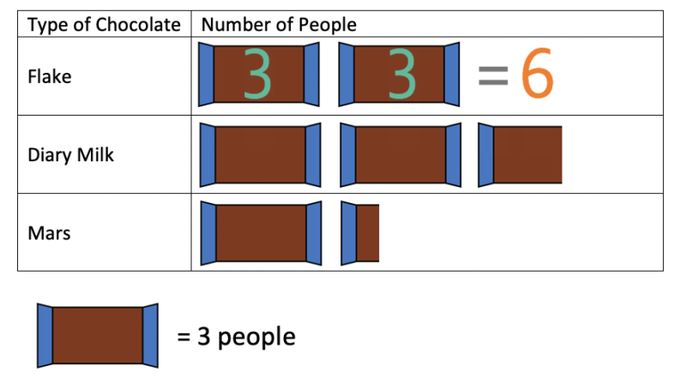
Let’s start by finding out the number of individuals whose favourite chocolate bar was flake. There are two full chocolate bars next to the flake. Each full chocolate bar represents 3 people, and this means that there are 6 people whose favourite chocolate bar is flake (2 x 3 = 6).
Let’s start by finding out the number of individuals whose favourite chocolate bar was flake. There are two full chocolate bars next to the flake. Each full chocolate bar represents 3 people, and this means that there are 6 people whose favourite chocolate bar is flake (2 x 3 = 6).
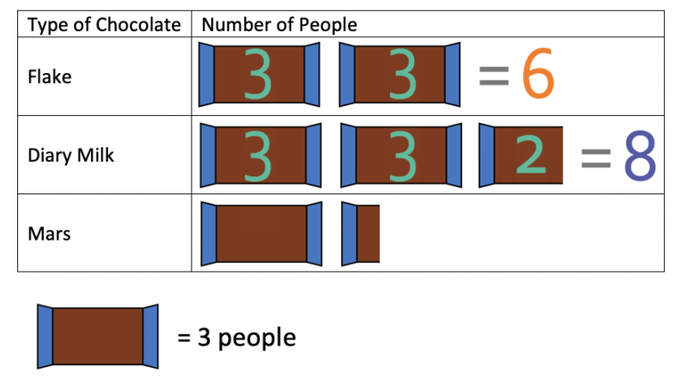
We are now going to do the same for Diary Milk. Dairy milk has two full chocolate bars and one part of a chocolate bar. Each of the two full chocolate bars represents 3 people, which means that these two chocolate bars represent 6 people. We now need to work out what the part of the chocolate bar represents. A full chocolate bar represents 3 people, which means that each third of the chocolate bar represents one person. The part of the chocolate bar is two thirds of a whole chocolate bar, which means that this part represents 2 people. Therefore, the number of people whose favourite chocolate bar is dairy milk is 8 (6 from the 2 full pictures and 2 from the part of a picture; 6 + 2 = 8).
Finally, we move onto the number of people whose favourite chocolate bar is mars. There is one full chocolate bar for Mars, which represents 3 people, and one third of a chocolate bar, which represents 1 person (remember, because a full chocolate bar represents 3 people, each third of a chocolate bar represents 1 person). Therefore, 4 people have their favourite chocolate bar as Mars.
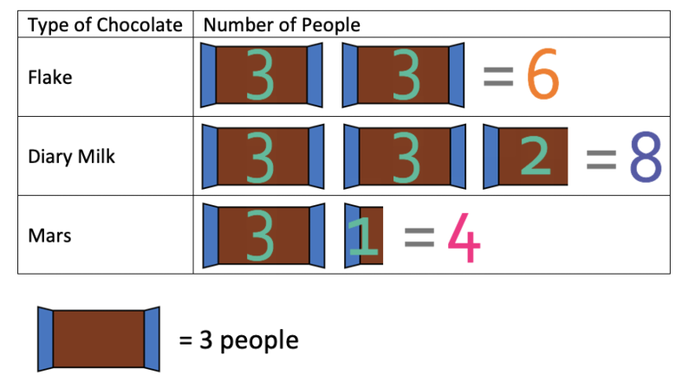
The final answer for this question would be 6 people had Flake as their favourite, 8 people had Diary Milk as their favourite and 4 people had Mars as their favourite.
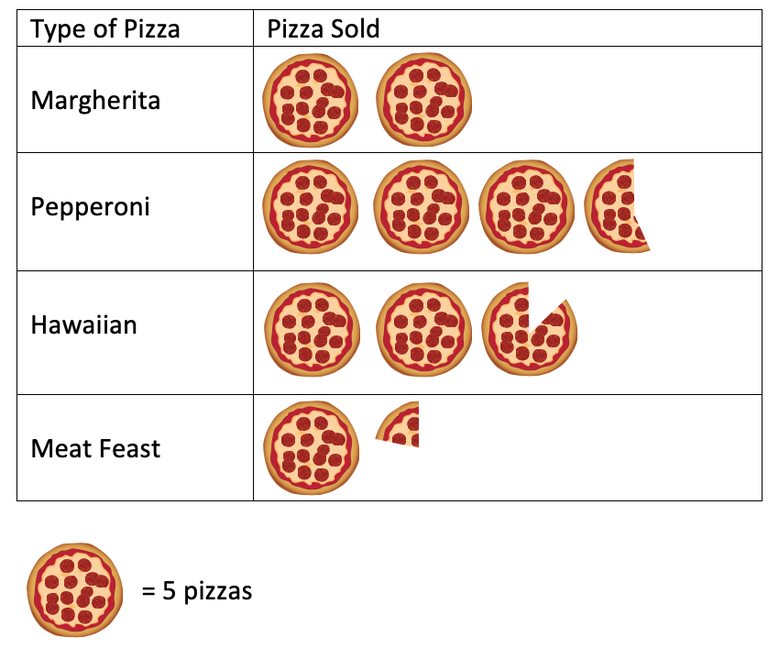
Example 2 – Creating a Pictogram
A pizza shop sells 4 different varieties of pizza. The number of the pizzas that they sell of each flavour is given below.
A pizza shop sells 4 different varieties of pizza. The number of the pizzas that they sell of each flavour is given below.
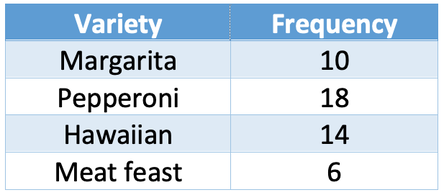
Put the data above into a pictogram where one pizza represents 5 orders.
In order to create the pictogram, we need to find out how many full and parts of pictures we need for each of the four varieties of pizza. We do this by using the formula below:
In order to create the pictogram, we need to find out how many full and parts of pictures we need for each of the four varieties of pizza. We do this by using the formula below:

Let’s do this for margarita pizza, which has a frequency of 10. The question tells us that one pizza represents 5 orders. We can sub these numbers into the formula:

Therefore, we need to have two pizzas to represent margarita. The start of the pictogram is shown below:
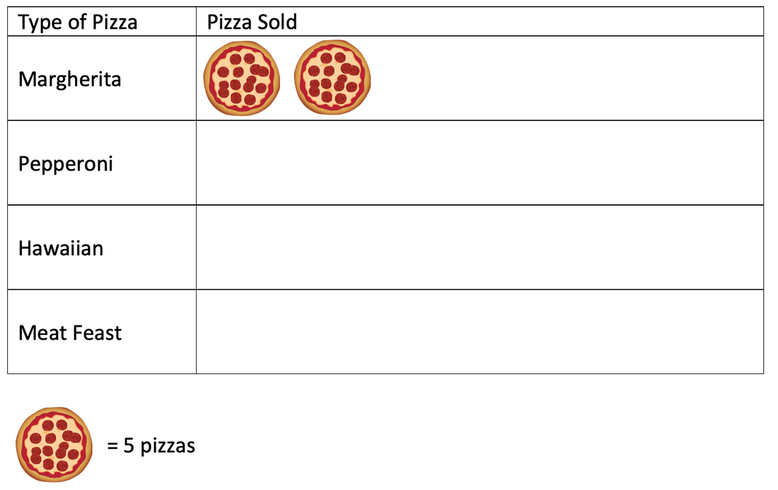
We now do the same for the other 3 varieties.
Pepperoni had a frequency of 18 and we sub 18 into the formula above.
Pepperoni had a frequency of 18 and we sub 18 into the formula above.
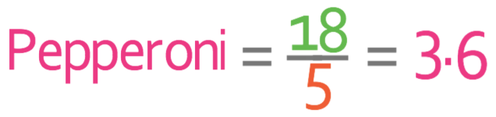
Pepperoni needs to have 3.6 pizzas; there will be 3 full pizzas and 3 fifths of another pizza.
Hawaiian has a frequency of 14, so we sub 14 into the formula.
Hawaiian has a frequency of 14, so we sub 14 into the formula.

Hawaiian will have 2.8 pizzas; 2 full pizzas and 4 fifths of another pizza.
Meat Feast has a frequency of 6, so we sub 6 into the formula.
Meat Feast has a frequency of 6, so we sub 6 into the formula.
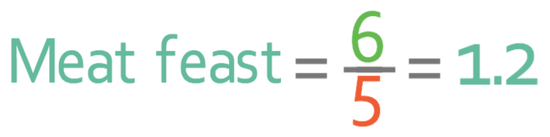
Meat feast will have 1.2 pizzas; 1 full pizza and 1 fifth of another pizza.
The complete pictogram is given below.
The complete pictogram is given below.
Example 3
Sometimes it will be the case that we are given a partially completed pictogram with no key and a partially completed table. We will then be asked to find the key and fill in the missing gaps. When this is the case, one of the options will have the value in the table and the pictures in the pictogram. We are able to use this information to find out what one image represents (the key). After we have the key, we can then fill in the gaps using the same methods as example 1 and 2. Let’s now have an example.
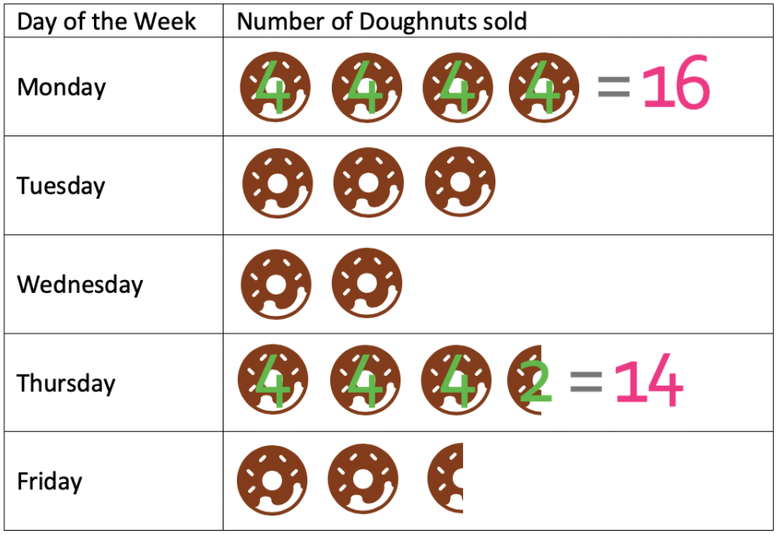
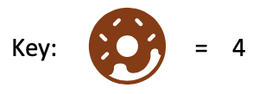
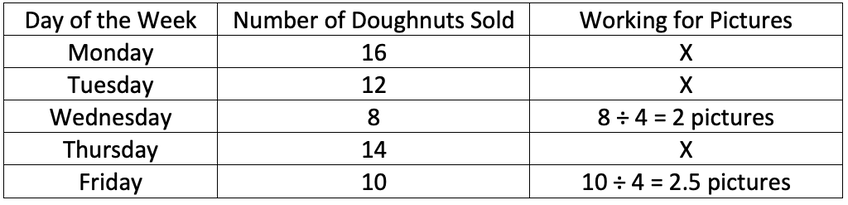
A doughnut shop records the sales of doughnuts made on weekdays last week. They have the following partially completed pictogram and table.
Sometimes it will be the case that we are given a partially completed pictogram with no key and a partially completed table. We will then be asked to find the key and fill in the missing gaps. When this is the case, one of the options will have the value in the table and the pictures in the pictogram. We are able to use this information to find out what one image represents (the key). After we have the key, we can then fill in the gaps using the same methods as example 1 and 2. Let’s now have an example.
A doughnut shop records the sales of doughnuts made on weekdays last week. They have the following partially completed pictogram and table.
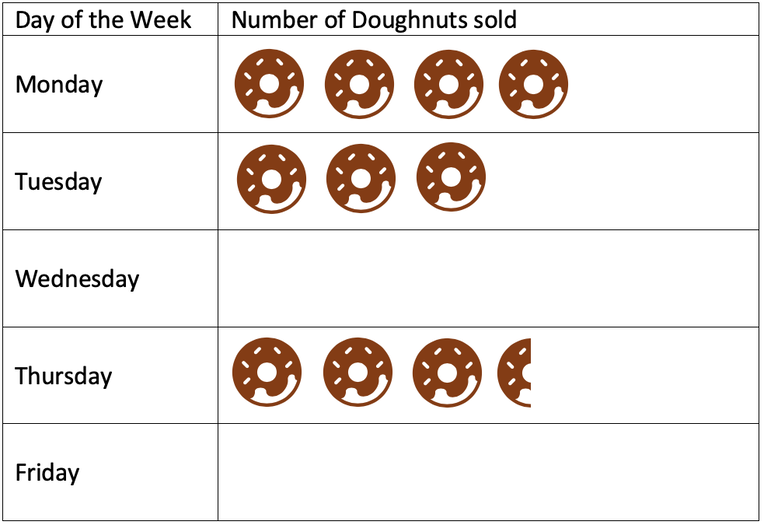
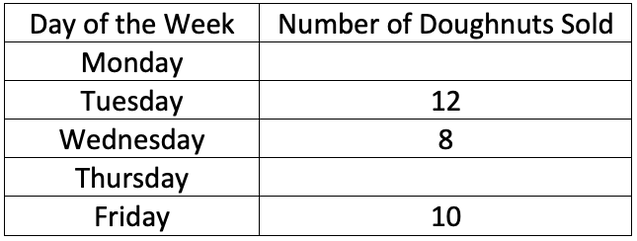
Complete the key and fill in the missing gaps in the pictogram and the table.
The first step in answering this question is to find the key. We are able to find the key by looking for the option where we are given both the pictures in the pictogram and the value in the table. When we look at the pictogram and table, we can see that we have been given the pictures and value for Tuesday; there are 3 doughnut pictures in the pictogram for Tuesday and the table tells us that 12 doughnuts were sold on Tuesday. We are able to create the following equation from this information:
The first step in answering this question is to find the key. We are able to find the key by looking for the option where we are given both the pictures in the pictogram and the value in the table. When we look at the pictogram and table, we can see that we have been given the pictures and value for Tuesday; there are 3 doughnut pictures in the pictogram for Tuesday and the table tells us that 12 doughnuts were sold on Tuesday. We are able to create the following equation from this information:

We want to find what 1 doughnut is equal to and not 3 doughnuts. Therefore, we divide both sides of the equation by 3.
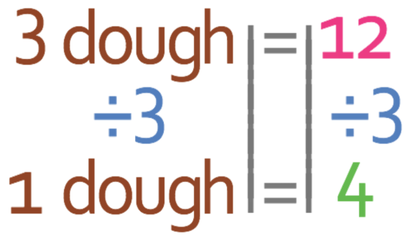
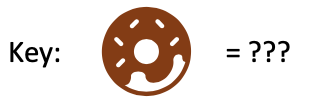
This tells us that 1 doughnut picture is equal to 4 doughnuts sold. We have now found the key, which is:

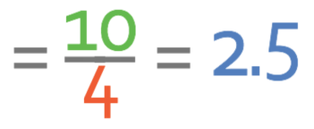
We are now able to fill in the gaps in the table and the pictogram. The working is shown below.