Back to Edexcel Representing Data (F) Home
Representing Data: Quiz 3 - Answers
Representing Data: Quiz 3 - Answers
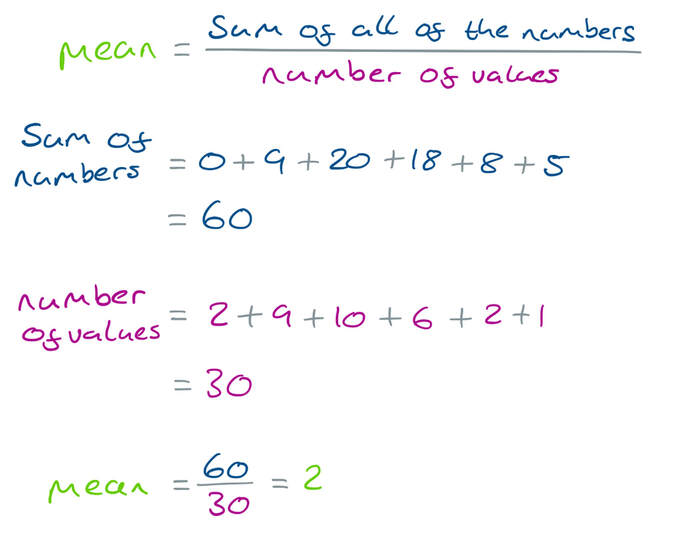
1) 2
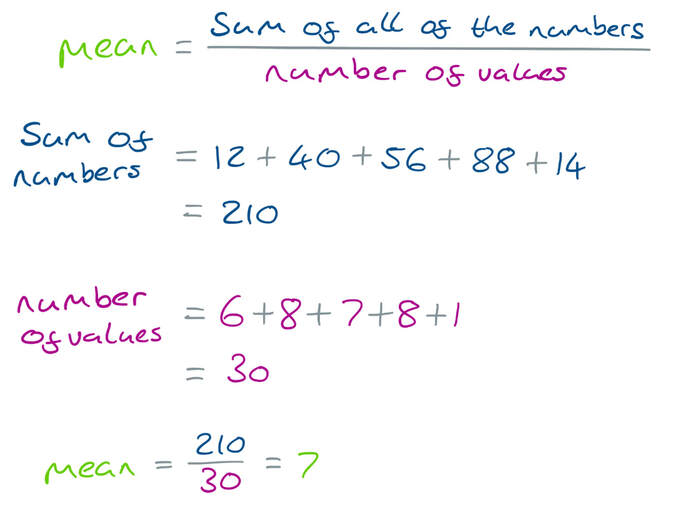
2) 7
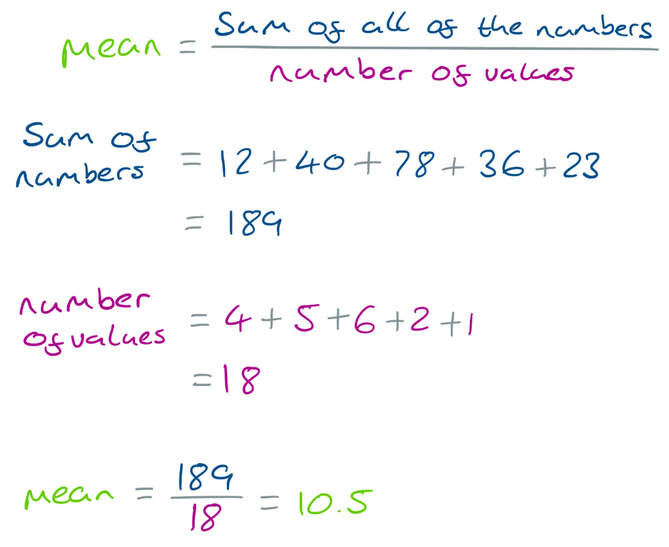
3) 10.5
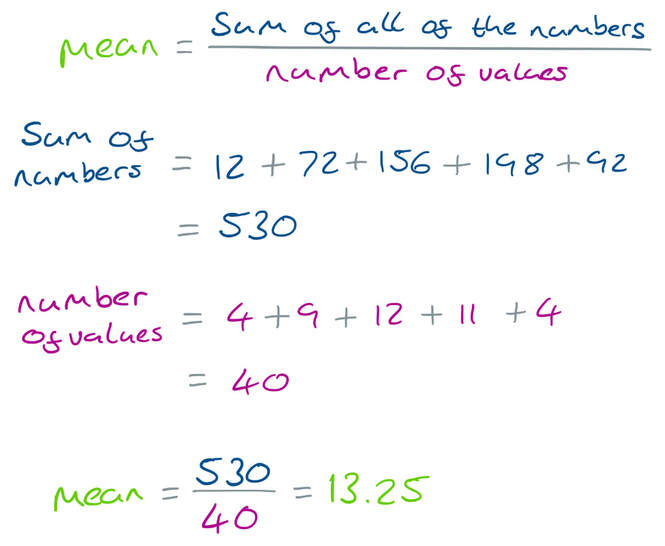
4) 13.25
2) 7
3) 10.5
4) 13.25
Working
Questions
Click here for a printable PDF of the graphs in this quiz.
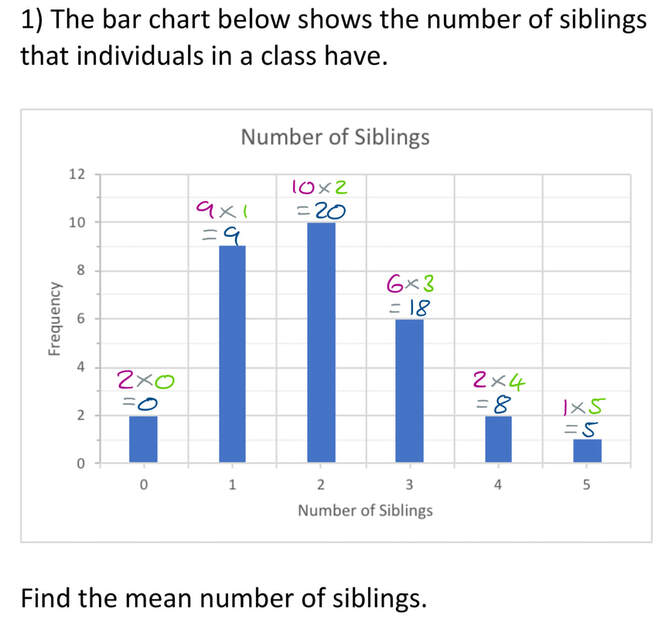
1) The bar chart below shows the number of siblings that individuals in a class have.
Click here for a printable PDF of the graphs in this quiz.
1) The bar chart below shows the number of siblings that individuals in a class have.
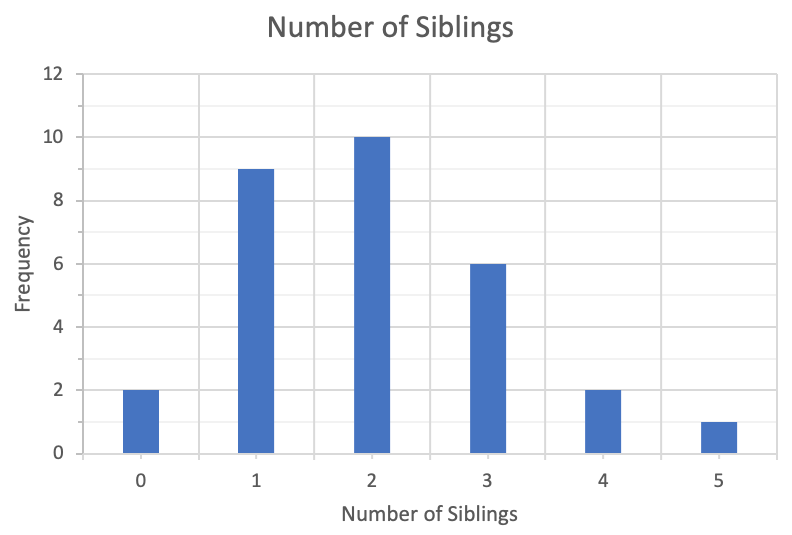
Find the mean number of siblings.
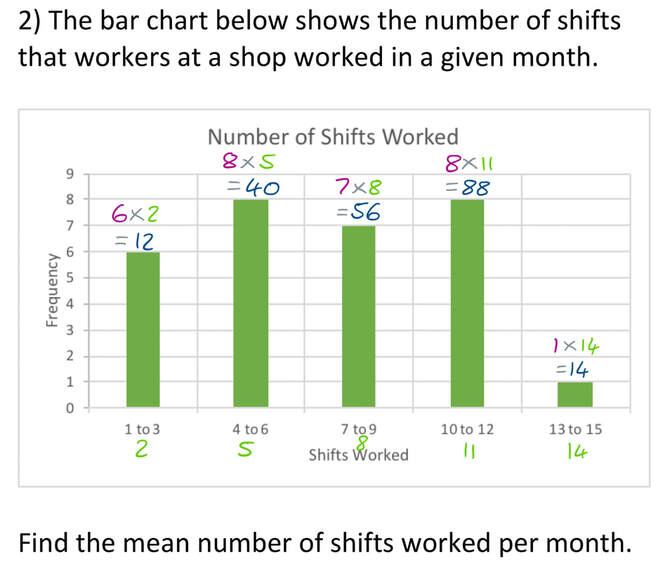
2) The bar chart below shows the number of shifts that workers at a shop worked in a given month.
2) The bar chart below shows the number of shifts that workers at a shop worked in a given month.
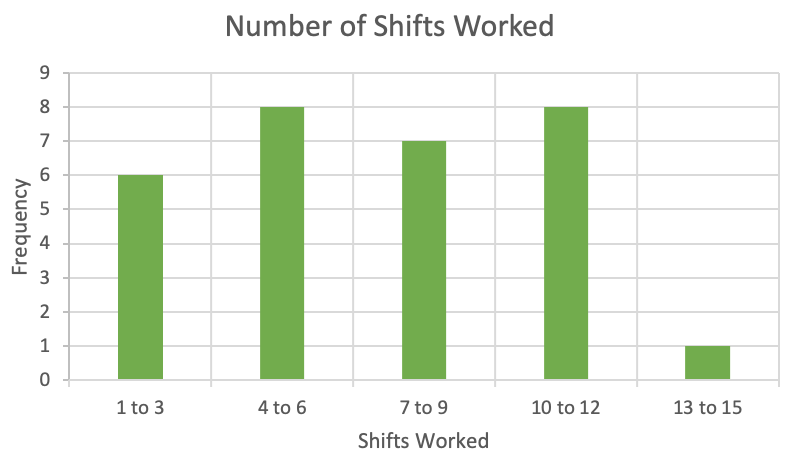
Find the mean number of shifts worked per month.
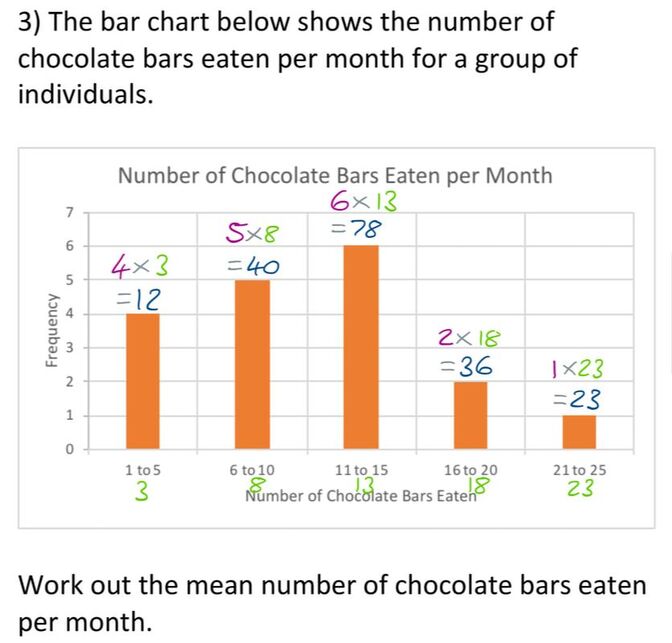
3) The bar chart below shows the number of chocolate bars eaten per month for a group of individuals.
3) The bar chart below shows the number of chocolate bars eaten per month for a group of individuals.
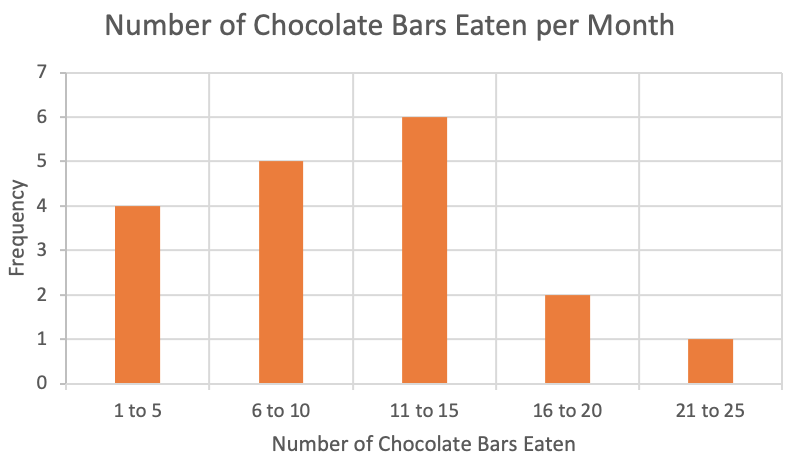
Work out the mean number of chocolate bars eaten per month.
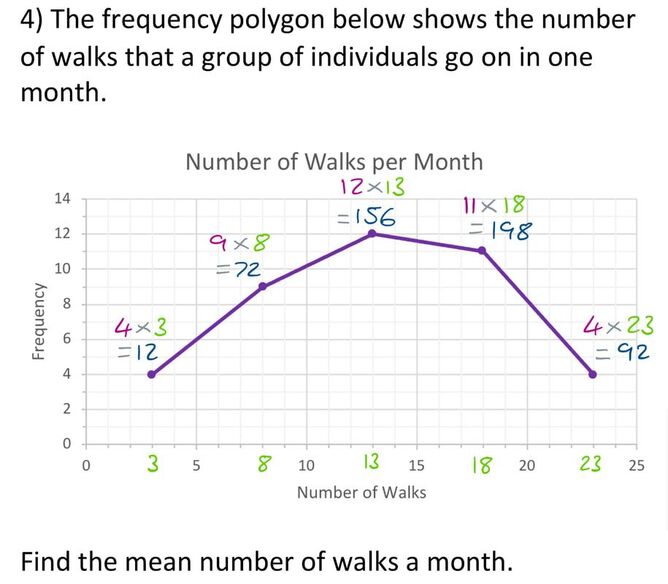
4) The frequency polygon below shows the number of walks that a group of individuals go on in one month.
4) The frequency polygon below shows the number of walks that a group of individuals go on in one month.
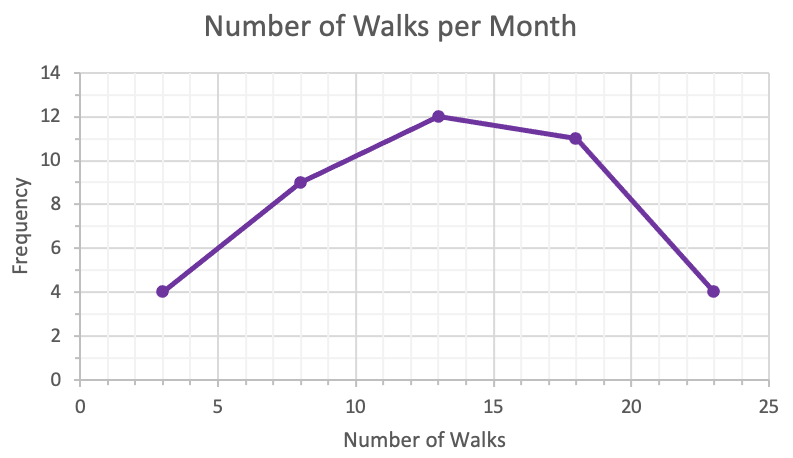
Find the mean number of walks a month.