Back to Edexcel Representing Data (F) Home
Representing Data: Quiz 4
Representing Data: Quiz 4
Click here for a printable PDF of the graphs in this quiz.
1) 5 students sat a Maths and a Science exam. The results are shown in the bar chart below.
1) 5 students sat a Maths and a Science exam. The results are shown in the bar chart below.
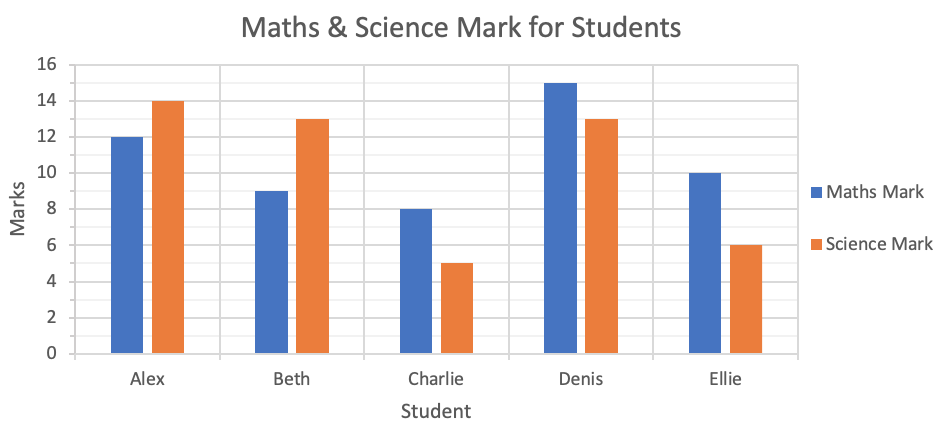
a) What was Charlie’s Maths mark?
b) What was Ellie’s Science mark?
c) Which individuals did better in Maths than Science?
d) Which individuals did better in Science than Maths?
e) Who got the worst Maths mark?
f) Who got the best Science mark?
g) Who had the smallest difference between their Maths and Science Mark, and what was the difference between their marks for the two tests?
2) The bar chart below shows the number of hours spent revising both at school and at home for maths in a particular week.
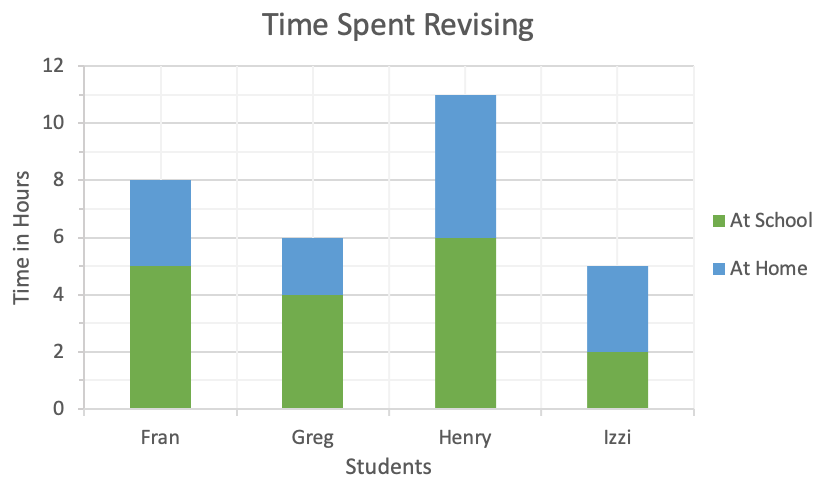
a) Who spent the most time revising in total?
b) Who spent the least time revising in total?
c) Who spent the most time revising at school?
d) Who spent the least time revising at home?
e) How many more hours did Fran spend revising at school compared to revising at home?
f) Write a ratio for the amount of time that Izzi spent revising at school to the amount of time that Izzi spent revising at home.
3) The table below shows the number of past paper questions that James and Lottie did last week.
b) Who spent the least time revising in total?
c) Who spent the most time revising at school?
d) Who spent the least time revising at home?
e) How many more hours did Fran spend revising at school compared to revising at home?
f) Write a ratio for the amount of time that Izzi spent revising at school to the amount of time that Izzi spent revising at home.
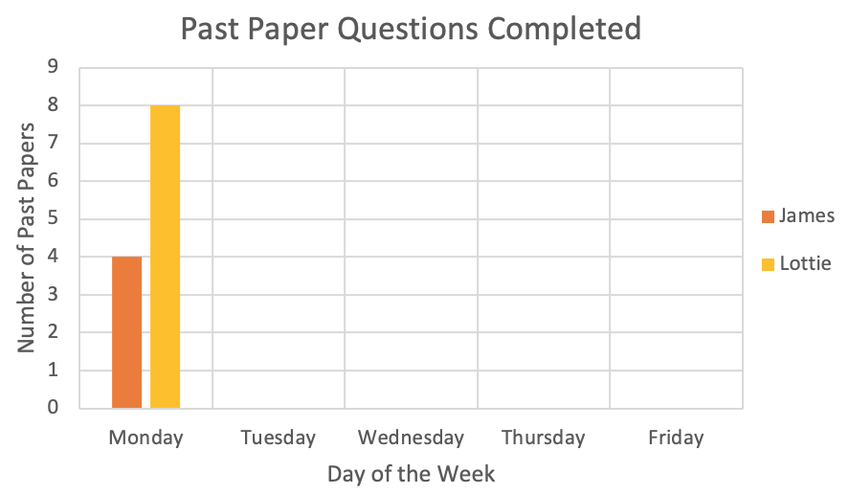
3) The table below shows the number of past paper questions that James and Lottie did last week.
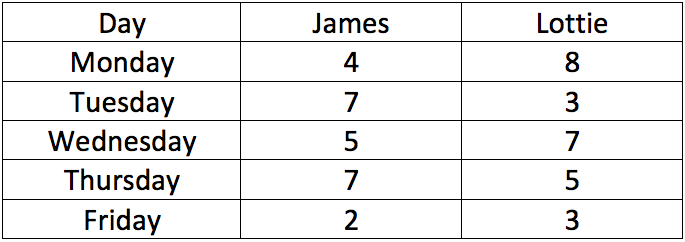
Complete the comparative bar chart. Monday has been done for you.
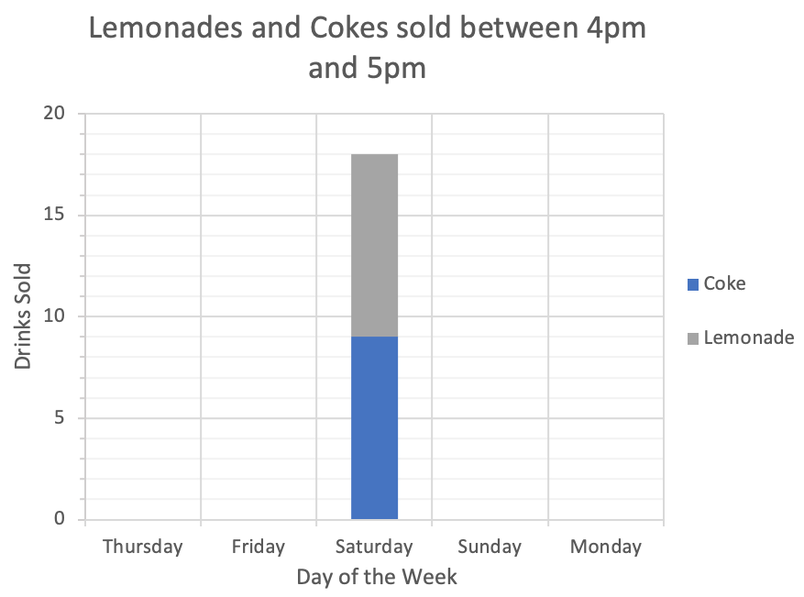
4) The table below shows the number of cokes and lemonades sold between 4pm and 5pm over the Easter weekend.
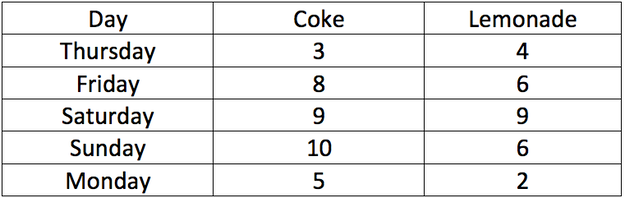
Complete the compound bar chart. Saturday has been done for you.