Back to Edexcel Representing Data (F) Home
Representing Data: Quiz 5
Representing Data: Quiz 5
Click here for a printable PDF of the pictograms and tables in this quiz.
1) The pictogram below shows information about the number of cookies sold by a shop from Monday to Friday.
1) The pictogram below shows information about the number of cookies sold by a shop from Monday to Friday.
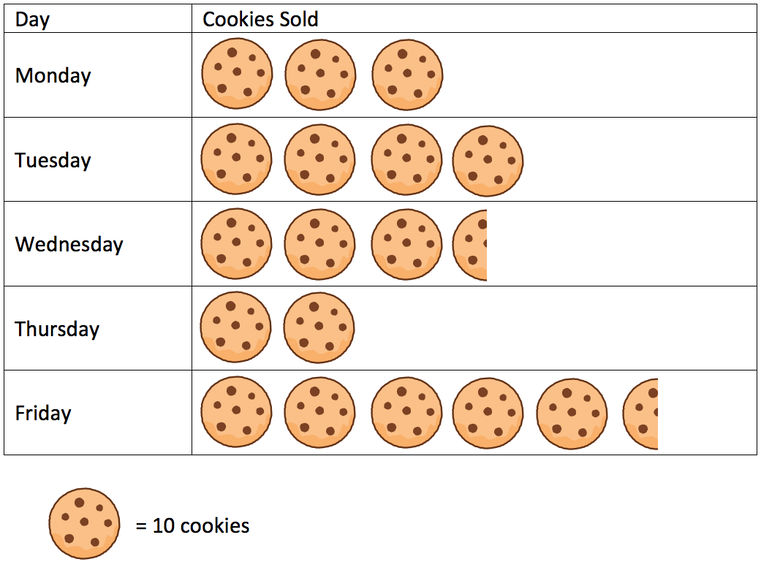
a) How many cookies were sold on Monday?
b) How many cookies were sold on Tuesday?
c) How many cookies does half a cookie represent?
d) How many cookies were sold on Wednesday?
e) On which day were the most cookies sold? Also, how many cookies were sold on this day?
f) On which day were the least cookies sold? Also, how many cookies were sold on this day?
2) The pictogram below shows the number of cars in a carpark over a given week.
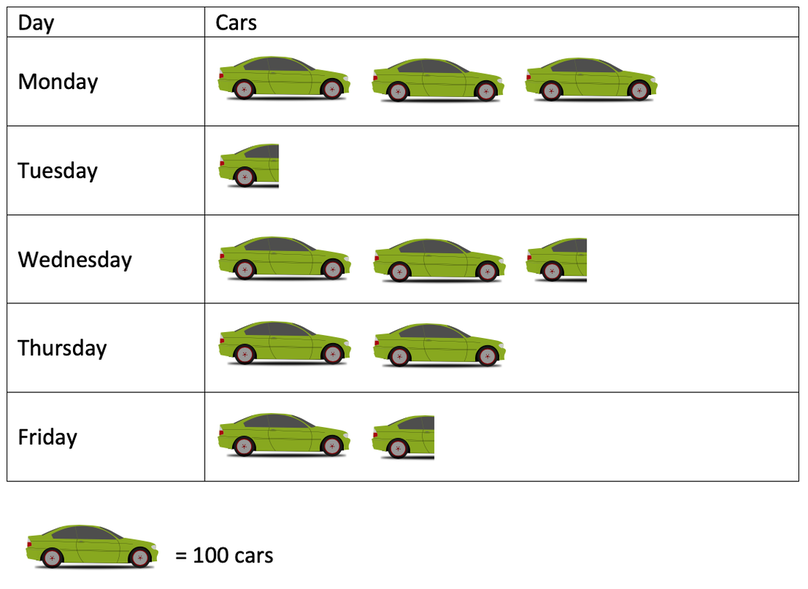
a) On which day were the greatest number of cars in the carpark? Also, how many cars were in the carpark on this day?
b) On which day were the least number of cars in the carpark? Also, how many cars were in the carpark on this day?
c) How many more cars were in the carpark on a Wednesday compared to Friday?
3) The partially completed pictogram below shows the number different flavoured pizzas sold on a particular night.
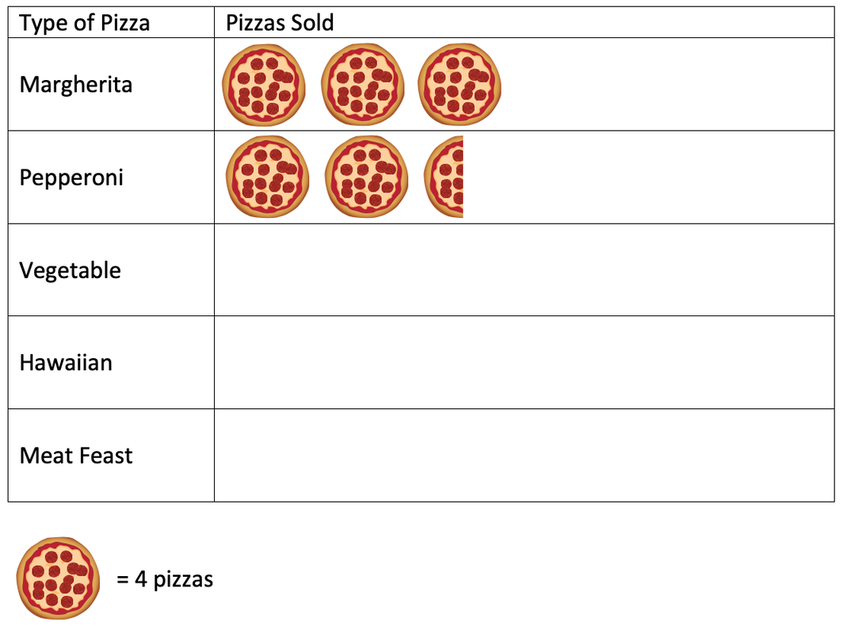
a) How many Margherita pizzas were sold?
b) How many Pepperoni pizzas were sold?
c) The pizzeria sold 8 Vegetable pizzas, 14 Hawaiian pizzas, 7 Meat Feast pizzas. Add this information to the pictogram.
d) What type of pizza was the most popular?
e) What type of pizza was the least popular?
4) I stand on a road for an hour and count the number of different coloured cars that pass me. A partially completed table and pictogram for the data that I gathered is shown below.
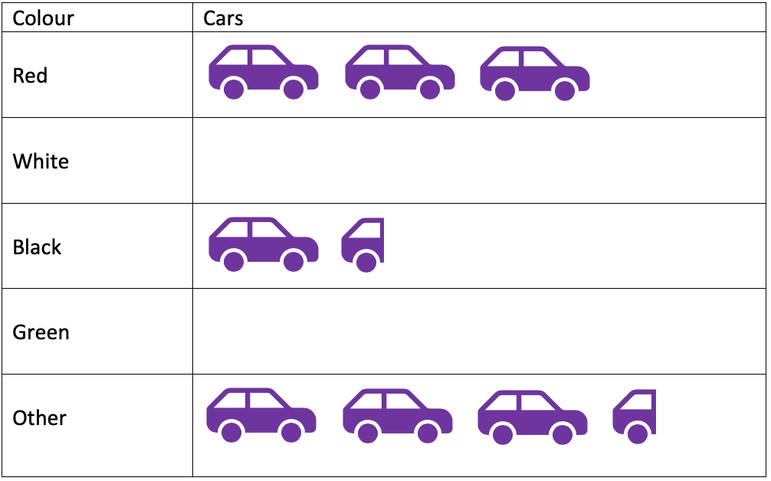
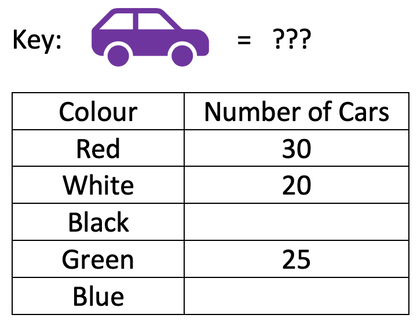
Complete the key and fill in the missing gaps in the pictogram and the table.
5) A shop gathers data on the number of CD sold of different genres of music. Their data is shown below in a partially completed table and pictogram.
5) A shop gathers data on the number of CD sold of different genres of music. Their data is shown below in a partially completed table and pictogram.
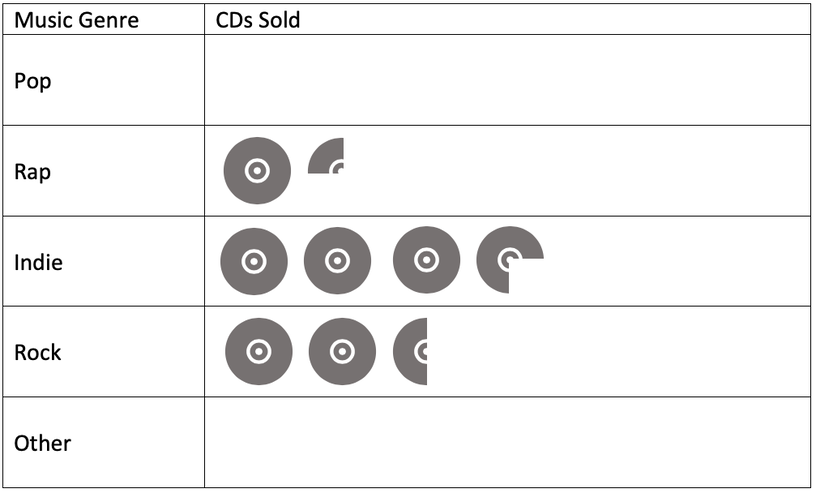
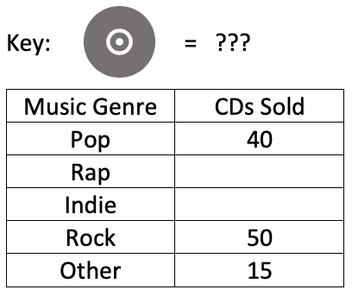
Complete the key and fill in the missing gaps in the pictogram and the table.