Back to Edexcel Linear Graphs (H) Home
2.5 A) Graph Basics
2.5 A) Graph Basics
In this section we are going to be looking at graphs that have been plotted by an equation. An example of an equation is y = 3x + 4, or y = x2 – 2x + 3. These two graphs are plotted below.
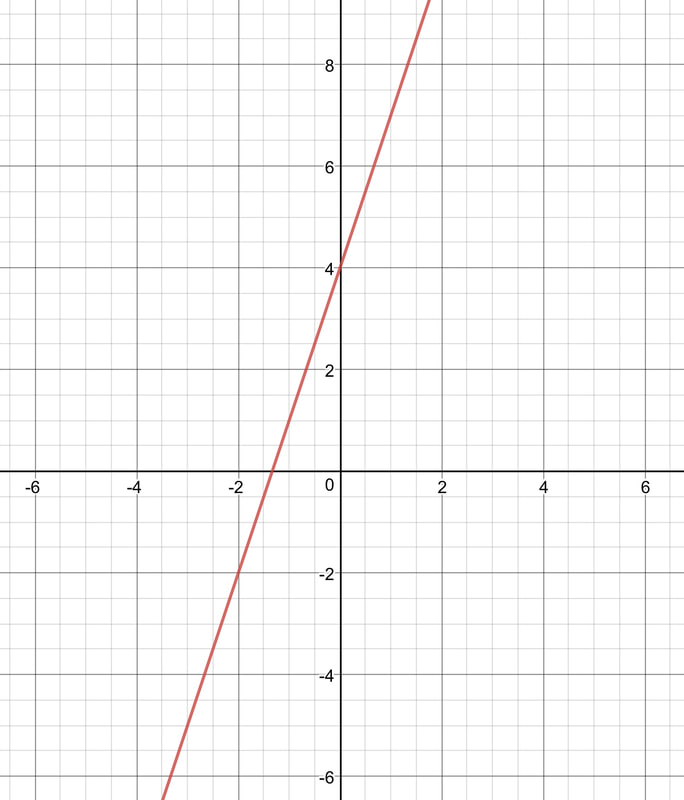
The graph y = 3x + 4
|
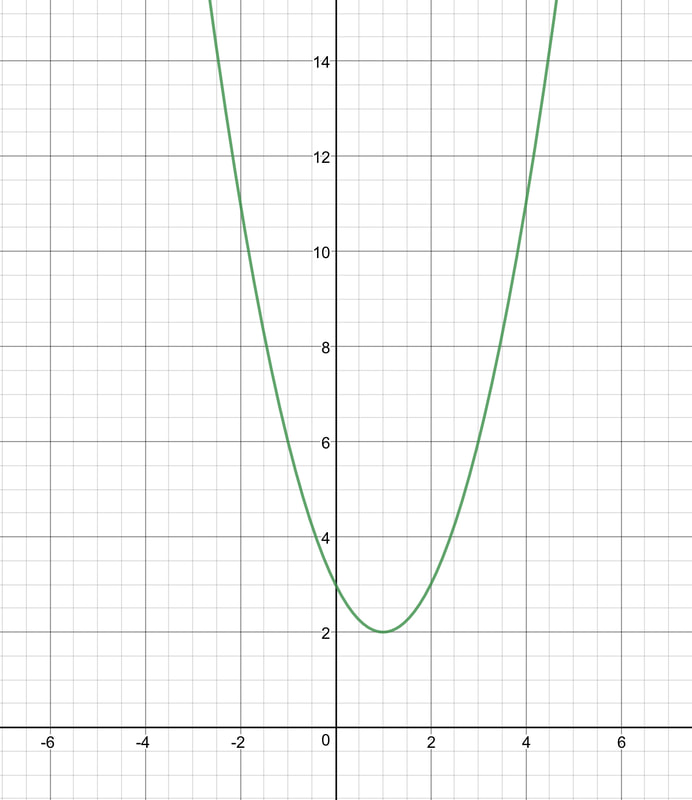
The graph y = x^2 – 2x + 3
|
The Graph in More Detail
There are two axes on a graph; the x axis and the y axis. The x axis runs horizontally with negative values on the left and positive values on the right. The y axis runs vertically with negative values at the bottom and positive values at the top.
There are two axes on a graph; the x axis and the y axis. The x axis runs horizontally with negative values on the left and positive values on the right. The y axis runs vertically with negative values at the bottom and positive values at the top.
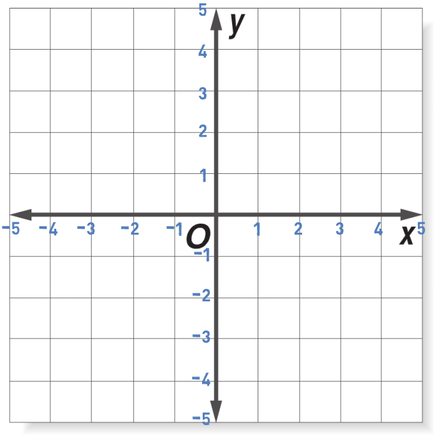
The origin is the point on the graph where the two axis cross and it has the coordinates (0,0). The first value in the coordinate’s brackets is the value for x and the second value in the coordinate brackets is the value for y. The best way to remember this is to use the phrase “along the corridor and up the stairs”.
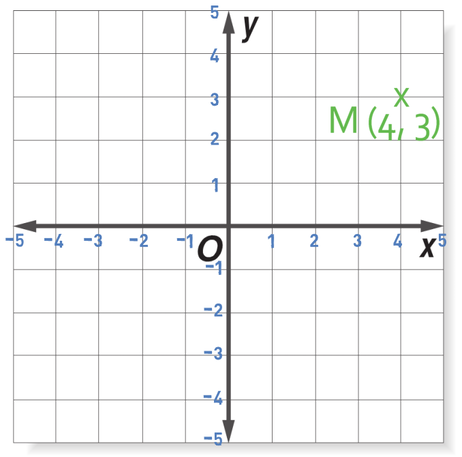
For example, suppose that we had the point M that had the coordinates (4, 3). The x coordinates for M is 4, which means that we are moving 4 to the right from the origin. The y coordinates is 3, which means that we are moving up by 3.
For example, suppose that we had the point M that had the coordinates (4, 3). The x coordinates for M is 4, which means that we are moving 4 to the right from the origin. The y coordinates is 3, which means that we are moving up by 3.
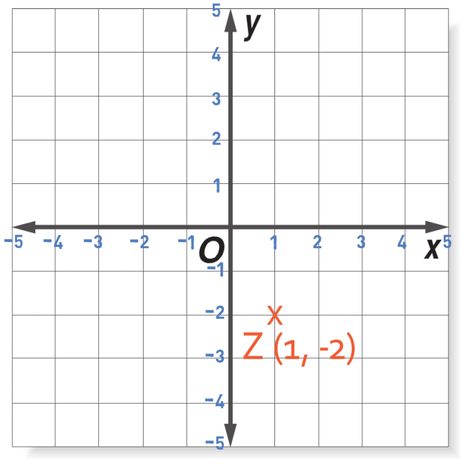
Let’s now plot the point Z, which has the coordinates (1, -2). The x coordinate is 1, which means that we are moving 1 to the right from the origin. The y coordinate is -2, which means that we will be moving 2 down.
We are now going to find the coordinates for a point on a graph. What are the coordinates for point A?
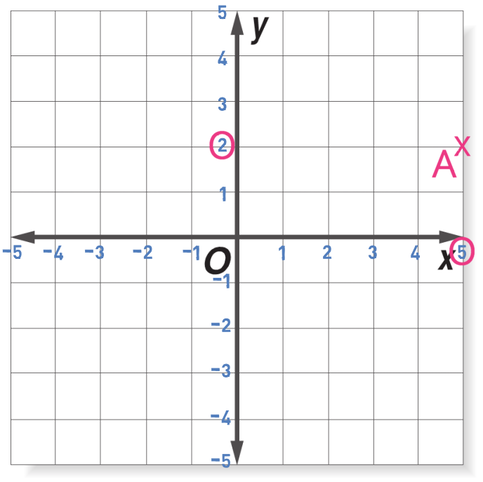
To find the coordinates, we need to find what the x coordinate is and what the y coordinate is. We find the x coordinate by going from the point to the x axis, which we do by going down or up from our point. And, we find the y coordinate by going to the y axis, which we do by going left or right from our point.
For point A, we go down to find the x value, which is 5, and we go left to find the y coordinate, which is 2. Therefore, point A has the coordinates (5, 2).
For point A, we go down to find the x value, which is 5, and we go left to find the y coordinate, which is 2. Therefore, point A has the coordinates (5, 2).
Four Quadrants
There are four quadrants for a graph; top right, bottom right, bottom left and top left.
There are four quadrants for a graph; top right, bottom right, bottom left and top left.
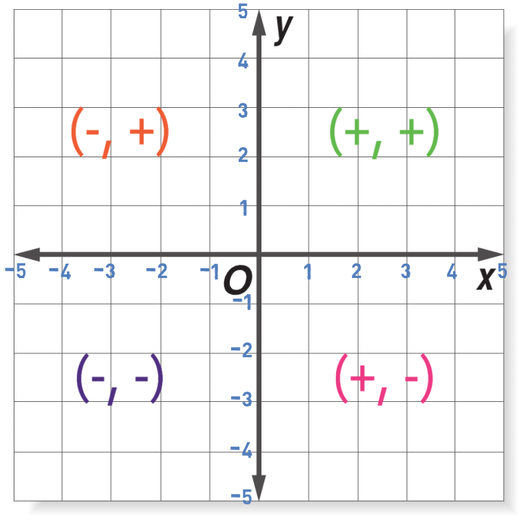
The top right quadrant has positive values for both x and y. The bottom right quadrant has positive values for x and negative values for y. The bottom left quadrant has negative values for both x and y. Finally, the top left quadrant has negative values for x and positive values for y.
Feel free to plot some points in each of the quadrants, find the coordinates of the points that you have plotted, and check that the signs for the x and y coordinates are the same as the signs for the respective quadrants on the graph above.
Feel free to plot some points in each of the quadrants, find the coordinates of the points that you have plotted, and check that the signs for the x and y coordinates are the same as the signs for the respective quadrants on the graph above.