Back to Edexcel Transformations of Curves (H) Home
2.9 A) Translations Parallel to the y axis
2.9 A) Translations Parallel to the y axis
There are quite a few different transformations of functions that we will look at in this whole section. In the sections before this, we learn that a function can be written as:

Where “…” stands for a particular function, such as “3x + 5”, or “5x2 + 2x – 7”.
In the sections before, you may have thought that writing a graph/ function as f(x) is a bit pointless, but you will see in this section that it is much easier to apply transformations to a function when it is written in f(x) form.
Translations Parallel to the y axis
A translation parallel to the y axis will result in the curve moving up or down. A translation parallel to the y axis will look like what is shown below:
A translation parallel to the y axis will result in the curve moving up or down. A translation parallel to the y axis will look like what is shown below:

When the value of a is positive, all of the points on the curve will move up by the value of a. When the value of a is negative, all of the points on the curve will move down by the value of a.
Example 1
In order to look through an example, we need to have a function; at the moment, we do not know what f(x) actually is. I am going to use a fairly simple function, which will be:
Example 1
In order to look through an example, we need to have a function; at the moment, we do not know what f(x) actually is. I am going to use a fairly simple function, which will be:
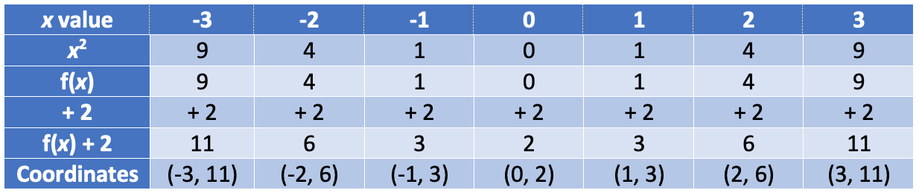
I am going to draw the function for x values between -3 and 3. Also, I am going to use a table to help me find the points on the curve and the table is shown below:
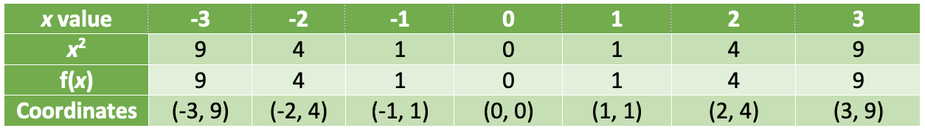
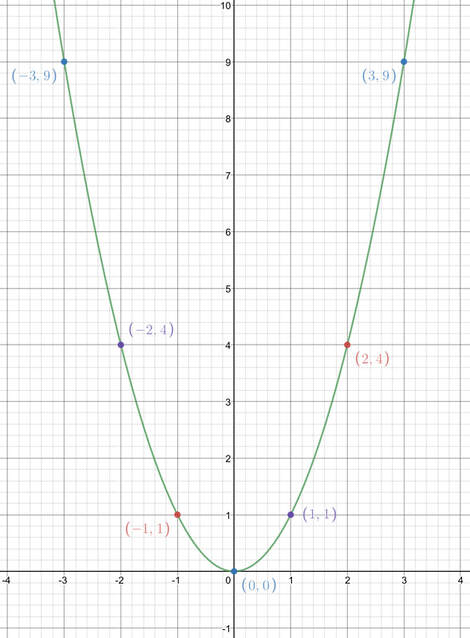
The function f(x) is plotted below.
We are now going to plot the graph of:

The table of values is shown below.
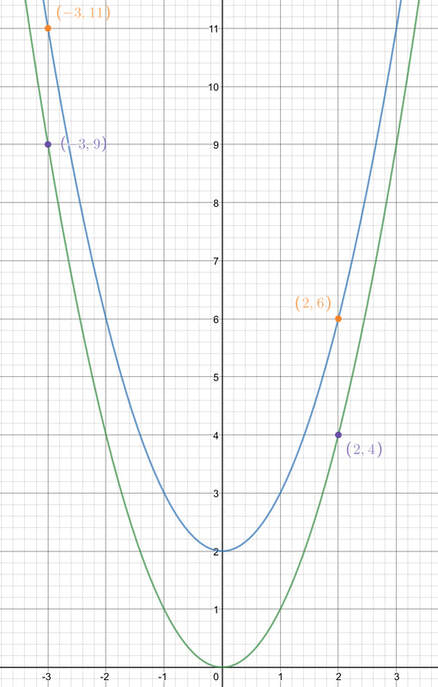
The graph below shows the function f(x) + 2 in blue and f(x) in green.
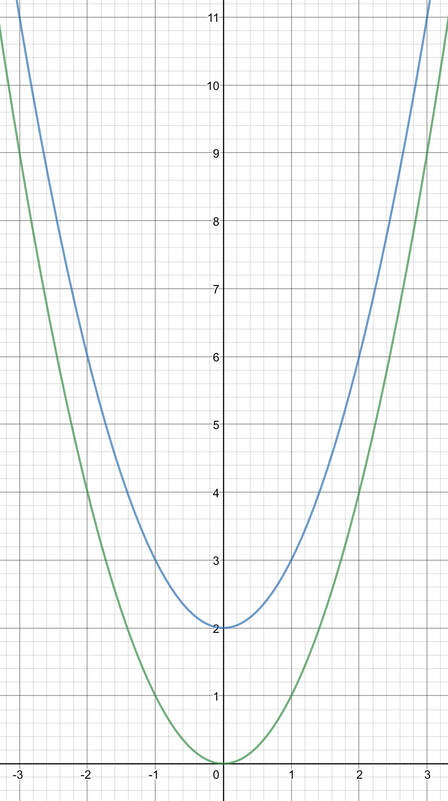
The green curve is f(x) and the blue curve is f(x) + 2.
From the graph and the coordinates in both of the tables, we can see that all of the points on the curve have moved up by 2 and this follows the rule that I stated earlier. The rule stated that for a positive value of a, all of the points on the curve will move up by the value of a. The value of a in this transformation was 2 and all of the points moved up by 2.
Another way of looking at a transformation like this is to add the value of a onto all of the y coordinates and keep the x value the same. For example, with f(x), the coordinates when x was -3 was (-3, 9). To find the coordinates when x is -3 for f(x) + 2, we add the value of a (which is 2) onto the y coordinate. The working is shown below:
Another way of looking at a transformation like this is to add the value of a onto all of the y coordinates and keep the x value the same. For example, with f(x), the coordinates when x was -3 was (-3, 9). To find the coordinates when x is -3 for f(x) + 2, we add the value of a (which is 2) onto the y coordinate. The working is shown below:
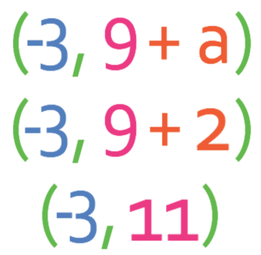
The coordinates for f(x) + 2 when x is -3 is (-3, 11) and we can see that this is the case on both the graph and in the table.
Let’s now check the coordinates when the x value is 2. When the value of x was 2, the coordinates for f(x) was (2, 4). We find the coordinates for f(x) + 2 by adding 2 to the y value.
Let’s now check the coordinates when the x value is 2. When the value of x was 2, the coordinates for f(x) was (2, 4). We find the coordinates for f(x) + 2 by adding 2 to the y value.
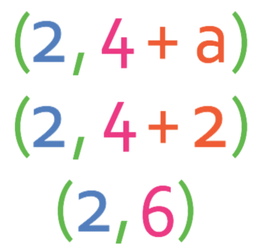
The coordinates for f(x) + 2 when x is 2 is (2, 6) and we can see that this is the case on both the graph and in the table.
The green curve is f(x) and the blue curve is f(x) + 2.
You do not need to use the table in the exam, I just think that the table is useful to help you understand what is happening.
A Negative Value for a
We are now going to have an example when we have a negative value for a. We are going to be using the same function as above, which is:
We are now going to have an example when we have a negative value for a. We are going to be using the same function as above, which is:

Example 2
Sketch the graph:
Sketch the graph:
The value of a here is negative (– 4) and this means that all of the points on the curve will move down by 4.
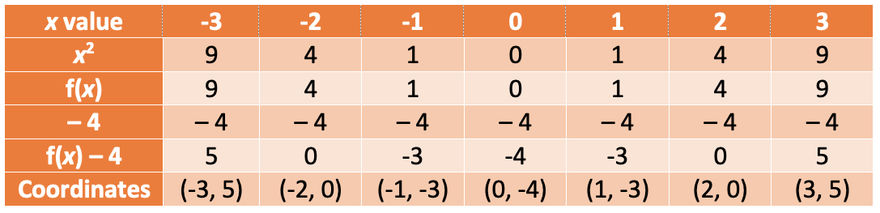
I am going to use the table again, just to show that all of the points do move down by 4.
I am going to use the table again, just to show that all of the points do move down by 4.
Both f(x) and f(x) – 4 are drawn on the graph below; f(x) is drawn in green and f(x) – 4 is drawn in orange.
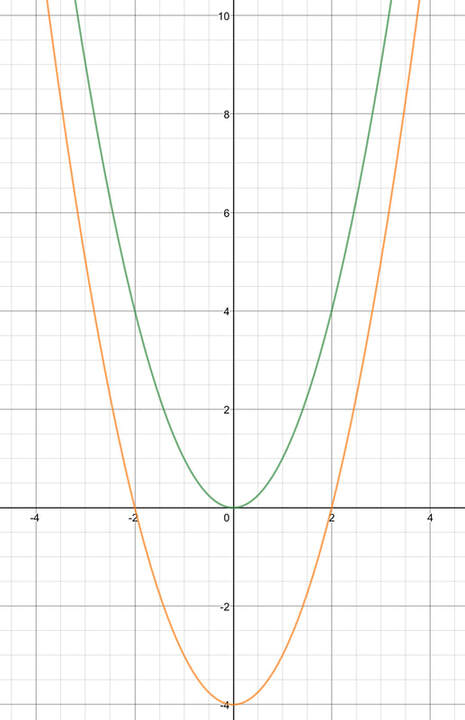
The green curve is f(x) and the orange curve is f(x) – 4.
From looking at the two curves on the graph above, you can see that all of the points on the curve f(x) [the green curve] have moved down by 4 to give us the curve f(x) – 4 [the orange curve].
Example 3
The graph below shows the function g(x).
The graph below shows the function g(x).
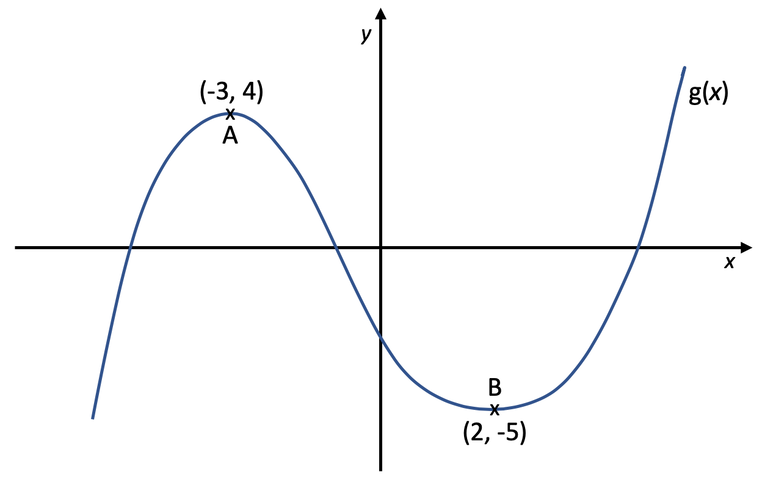
There are two points shown on the curve; point A and point B. Point A has the coordinates (-3, 4) and point B has the coordinates (2, -5).
For the two translations below, quickly sketch the new curve and show what the new coordinates are for point A and point B.
Part 1
The first translation is g(x) – 2. The value of a for this translation is negative, which means that all of the points on the function g(x) are going to move down by 2.
There are two ways that we can obtain the coordinates for A and B on the translated curve. One way is to just take 2 from the y coordinates for A and B because we know that the curve is moving down by 2. The other method is to add the value of a onto the y coordinate (I am going to do this). Both of these methods will give you the same answer for point A and B on the translated curve.
The coordinates for A on g(x) are (-3, 4) and the value of a in the translated function g(x) – 2 is -2. Therefore, we add -2 onto the y coordinate to obtain the coordinates for A on g(x) – 2. The working is shown below.
For the two translations below, quickly sketch the new curve and show what the new coordinates are for point A and point B.
- g(x) – 2
- g(x) + 5
Part 1
The first translation is g(x) – 2. The value of a for this translation is negative, which means that all of the points on the function g(x) are going to move down by 2.
There are two ways that we can obtain the coordinates for A and B on the translated curve. One way is to just take 2 from the y coordinates for A and B because we know that the curve is moving down by 2. The other method is to add the value of a onto the y coordinate (I am going to do this). Both of these methods will give you the same answer for point A and B on the translated curve.
The coordinates for A on g(x) are (-3, 4) and the value of a in the translated function g(x) – 2 is -2. Therefore, we add -2 onto the y coordinate to obtain the coordinates for A on g(x) – 2. The working is shown below.
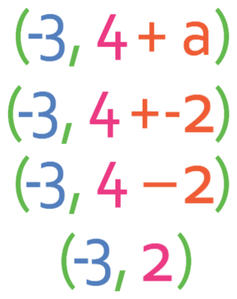
The coordinates for A on the translated curve are (-3, 2).
We do the same for B. The original coordinates of B are (2, -5), and we obtain the coordinates for B on the translated curve by adding the value of a, which is -2, onto the y coordinate.
We do the same for B. The original coordinates of B are (2, -5), and we obtain the coordinates for B on the translated curve by adding the value of a, which is -2, onto the y coordinate.
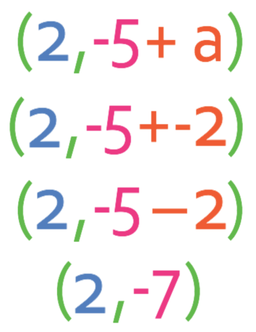
The coordinates for B are (2, -7).
I have sketched the translated curve [g(x) – 2] in orange on the graph below.
I have sketched the translated curve [g(x) – 2] in orange on the graph below.
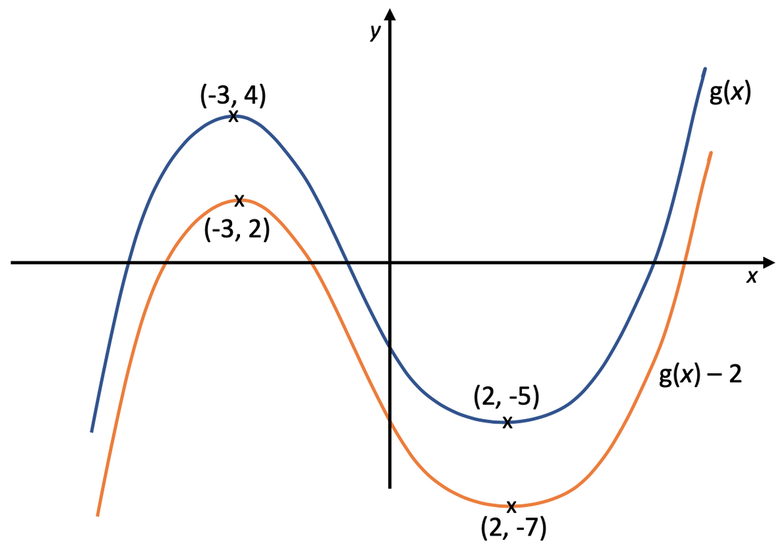
From looking at the two curves on the above graph, you can see that all of the points on the original curve have moved down by 2 to give us the translated curve.
Part 2
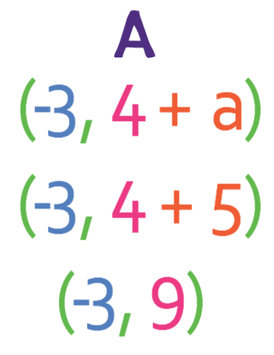
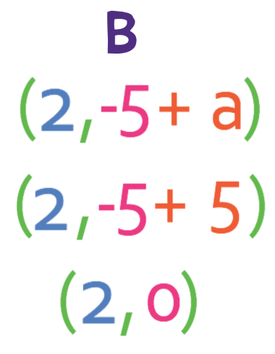
Let’s now find the coordinates of A and B for the graph g(x) + 5. The value of a in this translation is positive 5, which means that all of the points on g(x) are going to move upwards by 5.
Like part 1, there are two ways that we can obtain the coordinates for A and B. One way is to add 5 onto the y coordinates for A and B because we know that the curve is going to move up by 5. The other method is to add the value for a (which is 5) onto the y coordinates for A and B (I am going to use this method). The working is shown below.
Part 2
Let’s now find the coordinates of A and B for the graph g(x) + 5. The value of a in this translation is positive 5, which means that all of the points on g(x) are going to move upwards by 5.
Like part 1, there are two ways that we can obtain the coordinates for A and B. One way is to add 5 onto the y coordinates for A and B because we know that the curve is going to move up by 5. The other method is to add the value for a (which is 5) onto the y coordinates for A and B (I am going to use this method). The working is shown below.
|
|
This means that the coordinates for A on the translated curve are (-3, 9) and for B are (2, 0). A sketch of the translated curve is given below.
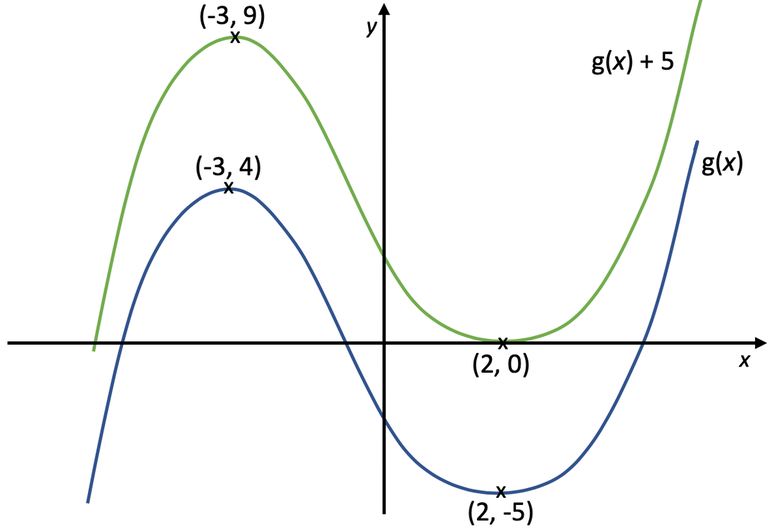
From looking at the two curves on the graph above, we can see that all of the points on the original curve (the blue one) have moved up by 5 to give us the translated curve (the green one).
End Note
A translation parallel to the y axis takes the form:
A translation parallel to the y axis takes the form:

A positive value for a results in the curve moving upwards. A negative value for a results in the curve moving downwards.
If we are given a point on the original curve and asked to find the coordinates for the point on the translated curve, we add the value of a onto the y coordinate. The x coordinate stays the same. The rule is summarised below:
If we are given a point on the original curve and asked to find the coordinates for the point on the translated curve, we add the value of a onto the y coordinate. The x coordinate stays the same. The rule is summarised below: