Back to Edexcel Transformations of Curves (H) Home
2.9 B) Translations Parallel to the x axis – Part 1
2.9 B) Translations Parallel to the x axis – Part 1
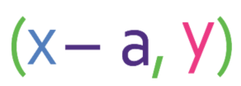
We are now going to have a look at translations that are parallel to the x axis, which means that the graph moves towards the left or the right. A translation parallel to the x axis happens when a number is added to or subtracted from the x inside the function bracket. An example of what the notation for a translation parallel to x axis is shown below:

We are going to use the same f(x) function as the previous section. The function is shown below:
There are two different ways that we can look at these translations:
Both of these methods are good for understanding, but in the exam, you should be able to get away with remembering the rule, which we will look at after we have gone through a few examples.
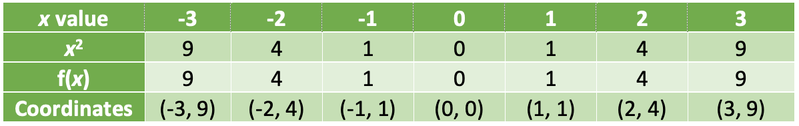
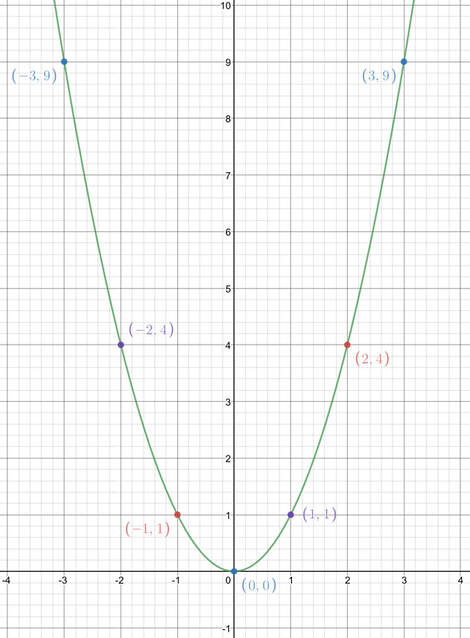
Like I said earlier, the function that we are going to be translating is f(x). A sketch of this function and the table of coordinates is shown below.
- The first way is to add the value of a to x and place the outcome into the function.
- The second method is to replace the values of x in the function with x + a.
Both of these methods are good for understanding, but in the exam, you should be able to get away with remembering the rule, which we will look at after we have gone through a few examples.
Like I said earlier, the function that we are going to be translating is f(x). A sketch of this function and the table of coordinates is shown below.
Example 1
Sketch the graph of:
Sketch the graph of:

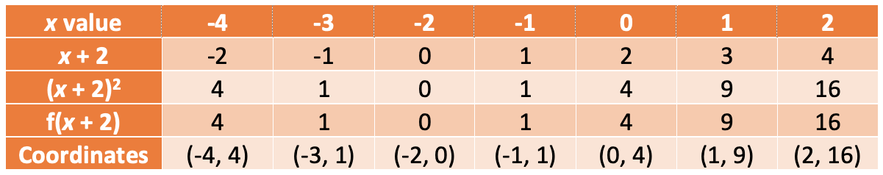
I am going to use both of the methods to find the coordinates that we need to sketch f(x + 2) . In the first method, we find the values for x for what is inside the bracket; for this translated function, the inside of the bracket is “x + 2”, so we find what “x + 2” is for the values of x. We then sub in the values for “x + 2” as x into the original function, which is f(x) = x2. The table is shown below.
We can now plot these coordinates and sketch the translated function. The curve f(x) is shown in green and the curve f(x + 2) is shown in orange.

The green curve is the function f(x) and the orange curve is the function f(x + 2)
From the sketch of the two curves above, we can see that all of the points on the original curve, f(x), have moved 2 to the left to give us the translated curve f(x + 2).
The Rule
This brings us on to the rule. A positive value for a (or a value being added to x) in the bracket will move the original curve to the left by the value that is in the bracket. Our values for a was 2, which means that all of the points on the original curve moved to the left by 2. If we are given the coordinates for a point on the original curve, we are able to find the coordinates of the respective point on the translated curve by taking the value of a from the x coordinate of the point that we have been given. The y coordinate for that point will remain the same. The rule is shown below:
This brings us on to the rule. A positive value for a (or a value being added to x) in the bracket will move the original curve to the left by the value that is in the bracket. Our values for a was 2, which means that all of the points on the original curve moved to the left by 2. If we are given the coordinates for a point on the original curve, we are able to find the coordinates of the respective point on the translated curve by taking the value of a from the x coordinate of the point that we have been given. The y coordinate for that point will remain the same. The rule is shown below:
For example, the minimum of the original function f(x) is (0, 0). We can find the minimum of f(x + 2) by taking the value of a from the x coordinate. The value of a in f(x + 2) is 2, so we take 2 away from the x coordinate.
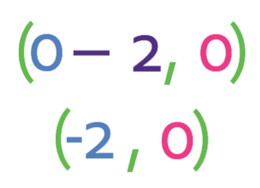
The minimum of the translated graph, f(x + 2), should be (-2, 0) and we can see from the sketch above that it is (-2, 0).
A negative value for a will result in the graph moving towards the right. We will see an example that has a negative value of a later on in this section.
A negative value for a will result in the graph moving towards the right. We will see an example that has a negative value of a later on in this section.
Back to Example 1
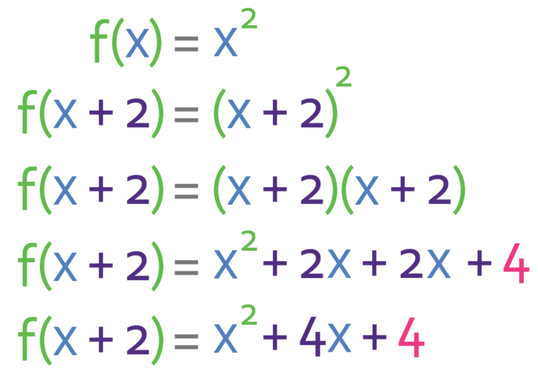
Let’s now use the second method for plotting the translated curve, which is to replace x in the function with what is in the bracket. What was in the bracket was “x + 2”, so we replace x in the function with “x + 2”. The working is shown below (I have multiplied the double brackets out by using FOIL; First, Outside, Inside and Last).
Let’s now use the second method for plotting the translated curve, which is to replace x in the function with what is in the bracket. What was in the bracket was “x + 2”, so we replace x in the function with “x + 2”. The working is shown below (I have multiplied the double brackets out by using FOIL; First, Outside, Inside and Last).
We can now sub x values into the equation that we have just found that represents f(x + 2). The table is shown below.
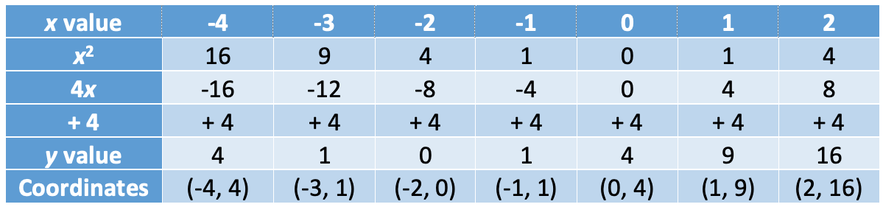
From the table, we can see that the coordinates are exactly the same as the other method.
This method becomes considerable trickier when we are looking at more complex functions that have many different terms that contain x’s. This is because, with this method, we need to replace every single x with what is in the bracket for the translated function. For example, suppose that we had the function h(x) and we want to sketch h(x – 4). The function h(x) is shown below:
This method becomes considerable trickier when we are looking at more complex functions that have many different terms that contain x’s. This is because, with this method, we need to replace every single x with what is in the bracket for the translated function. For example, suppose that we had the function h(x) and we want to sketch h(x – 4). The function h(x) is shown below:

In order to sketch the function h(x – 4), we would need to replace every x in h(x) with "x – 4".

From the above equation, we can see that this is going to be considerably more complex to find what the coordinates of the translated function are going to be. Therefore, this method is not the best method to use for translations that are parallel to the x axis. However, it is a good method for understanding the effect that adding or subtracting a number to x on the inside of the function bracket has.
Example 2
Sketch the graph of:
Sketch the graph of:

I am only going to use the first method to answer this question. This method involved finding the values for x for what is inside the bracket; the inside of the bracket for the translated function is “x – 3”, so we find the values for x for “x – 3”. We then sub in the values for “x – 3” as x into the original function, which is f(x) = x2.
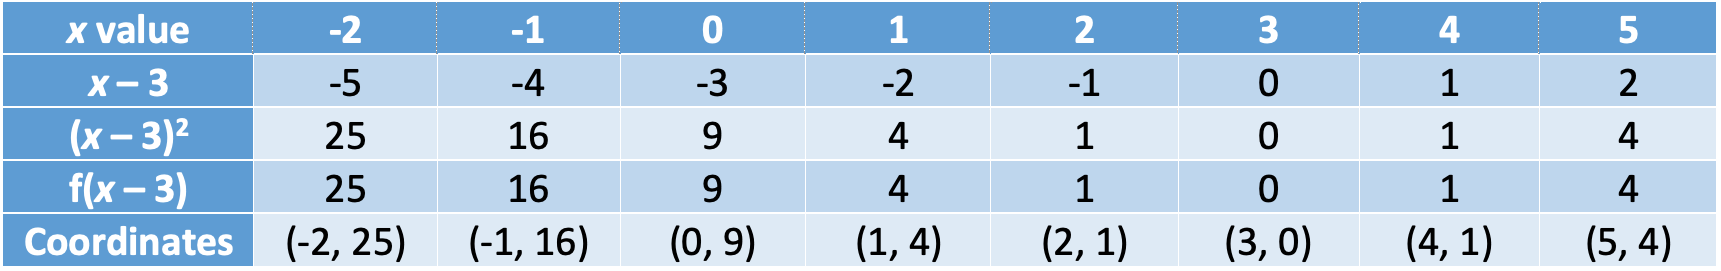
We can plot these coordinates to see what f(x – 3) looks like. The function f(x) is shown in green and the function f(x – 3) is shown in blue.
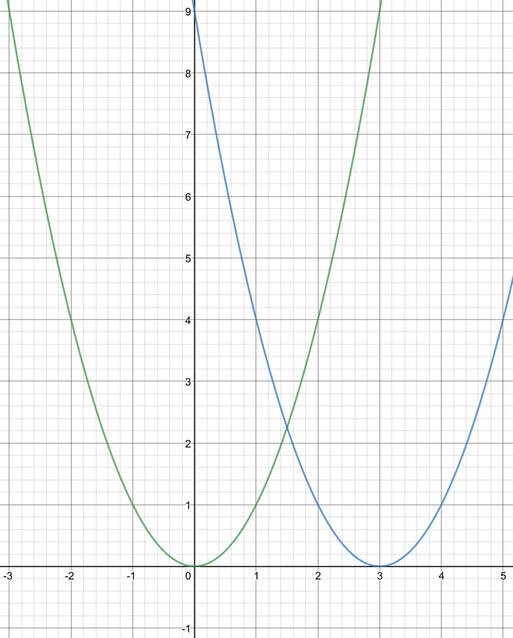
The green curve is the function f(x) and the blue curve is the function f(x – 3)
From the graph, we can see that the curve f(x) has moved 3 to the right. This follows the rule because a negative value for a results in the graph moving to the right (the value for a for this translated function was -3).
Also, we are able to find the coordinates of a particular point by taking the value of a from the x coordinate. Let’s use the minimum of the function, which has the coordinates (0, 0). In order to find the minimum for the function f(x – 3), we take the value of a from the x coordinate of the point that we are interested in on f(x). The value of a in the translated function f(x – 3) is -3, so we take -3 from the x coordinate. The working is shown below.
Also, we are able to find the coordinates of a particular point by taking the value of a from the x coordinate. Let’s use the minimum of the function, which has the coordinates (0, 0). In order to find the minimum for the function f(x – 3), we take the value of a from the x coordinate of the point that we are interested in on f(x). The value of a in the translated function f(x – 3) is -3, so we take -3 from the x coordinate. The working is shown below.
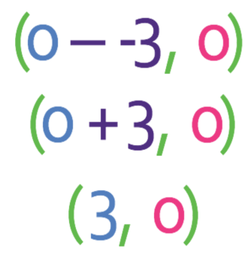
This tells us that the minimum of the translated curve is (3, 0). From the graph that we have just sketched, we can see that this is the case.