Back to Edexcel Transformations of Curves (H) Home
Transformation of Curves: Quiz 2
Transformation of Curves: Quiz 2
1) The graph shows the function f(x).
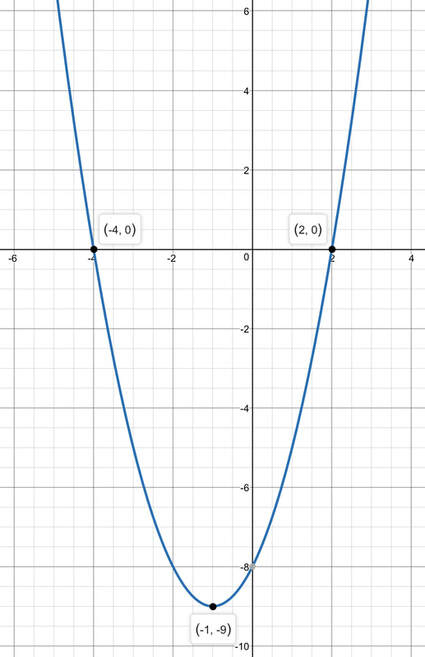
Sketch on separate graphs the following making sure that you give the coordinates of the minimum and where the curve crosses the x-axis.
a) f(x + 2)
b) f(x – 1)
c) f(x + 3)
d) f(x – ½)
e) f(x + 2.2)
2) The graph below shows the function g(x).
a) f(x + 2)
b) f(x – 1)
c) f(x + 3)
d) f(x – ½)
e) f(x + 2.2)
2) The graph below shows the function g(x).
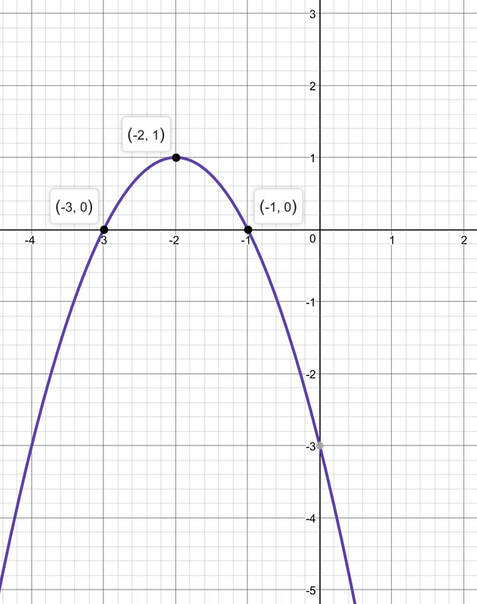
Sketch on separate graphs the following making sure that you give the coordinates of the maximum and where the curve crosses the x-axis.
a) g(x + 1)
b) g(x + 3)
c) g(x –1)
d) g(x – 4)
e) g(x + 2.5)
a) g(x + 1)
b) g(x + 3)
c) g(x –1)
d) g(x – 4)
e) g(x + 2.5)