Back to Edexcel Transformations of Curves (H) Home
Transformation of Curves: Quiz 5
Transformation of Curves: Quiz 5
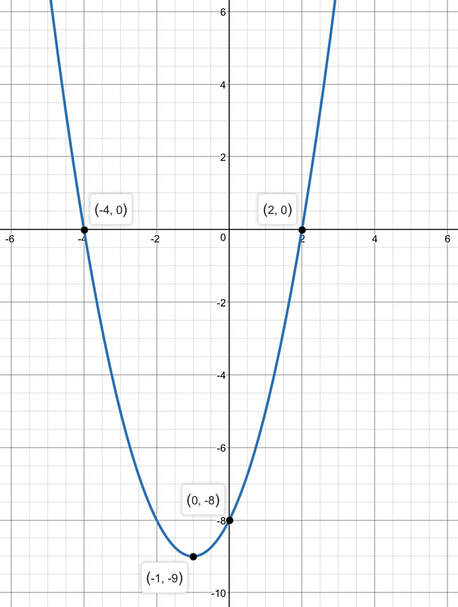
1) The graph below shows the function f(x). Sketch on separate graphs f(-x) making sure that you show the coordinates of the points where the curves crosses all of the axis and where the graph has a minimum.
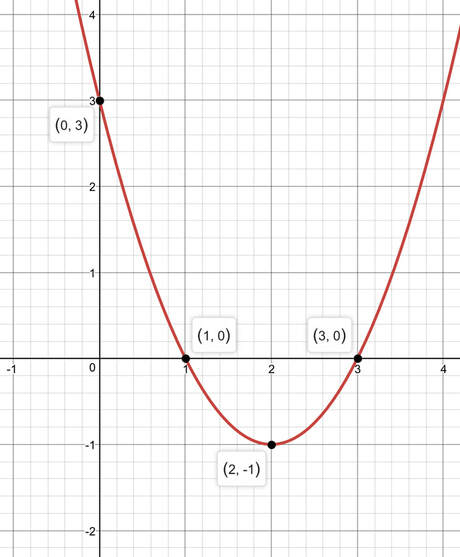
2) The graph below shows the function g(x). Sketch on separate graphs g(-x) making sure that you show the coordinates of the points where the curves crosses all of the axis and where the graph has a minimum.
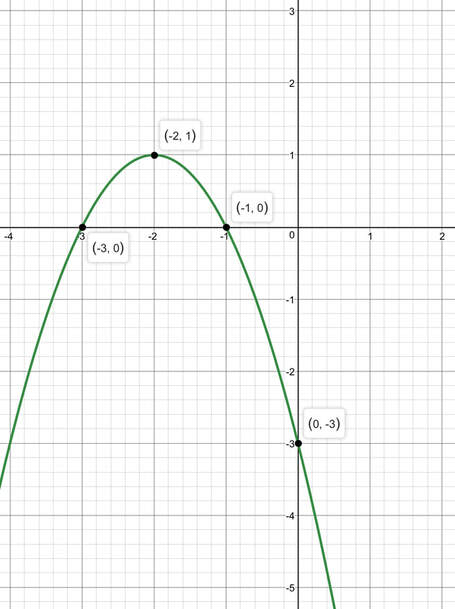
3) The graph below shows the function h(x). Sketch on separate graphs h(-x) making sure that you show the coordinates of the points where the curves crosses all of the axis and where the graph has a maximum.
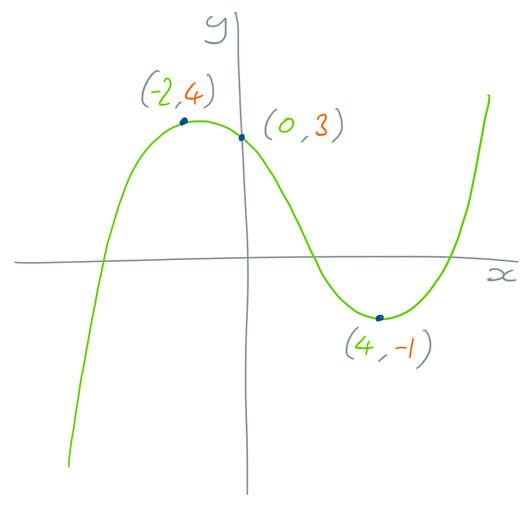
4) The graph below shows the function s(x). Sketch on separate graphs s(-x) making sure that you show the coordinates of the points where the curves crosses the y axis and the coordinates of the turning points of the graph.