Back to Edexcel Transformations of Curves (H) Home
Transformation of Curves: Quiz 6 – Answers
Transformation of Curves: Quiz 6 – Answers
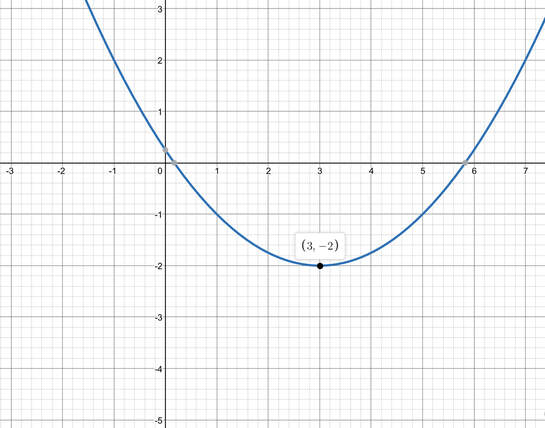
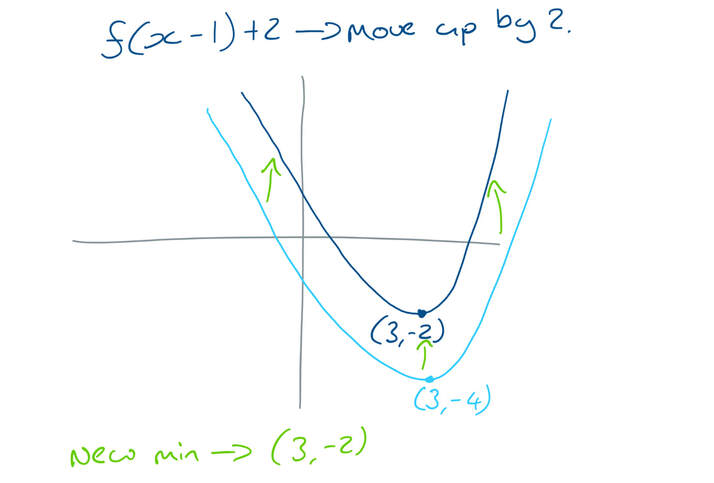
1) Coordinates (3, -2)
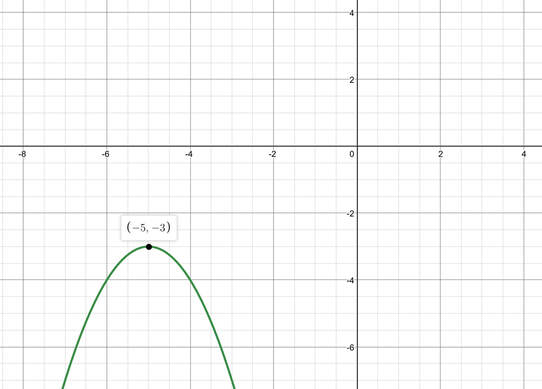
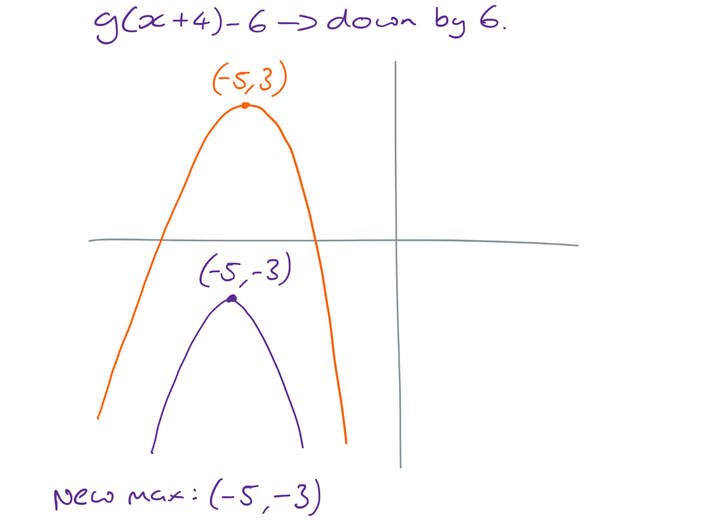
2) Coordinates (-5, -3)
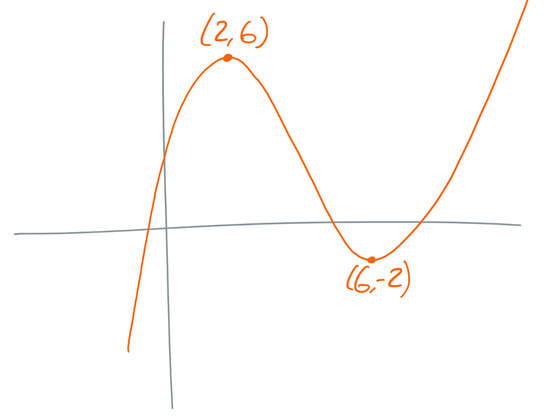
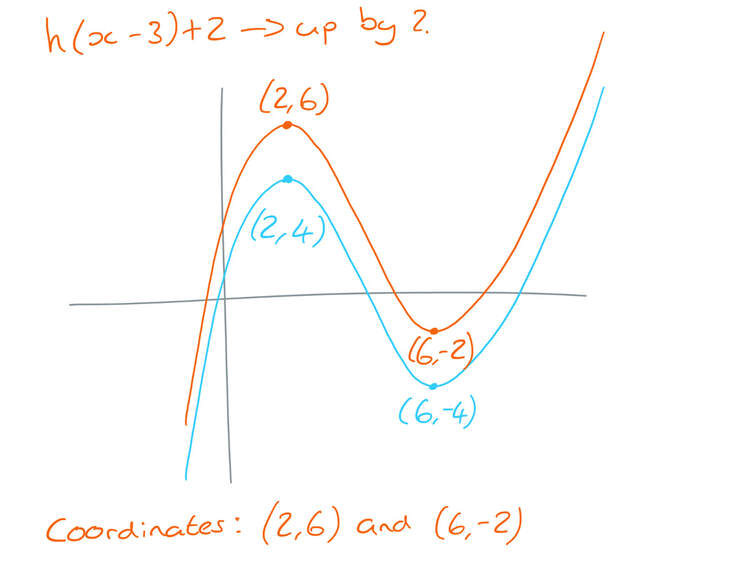
3) Coordinates (2, 6) and (6, -2)
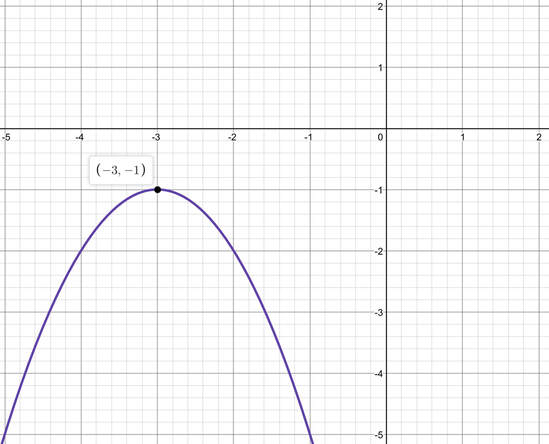
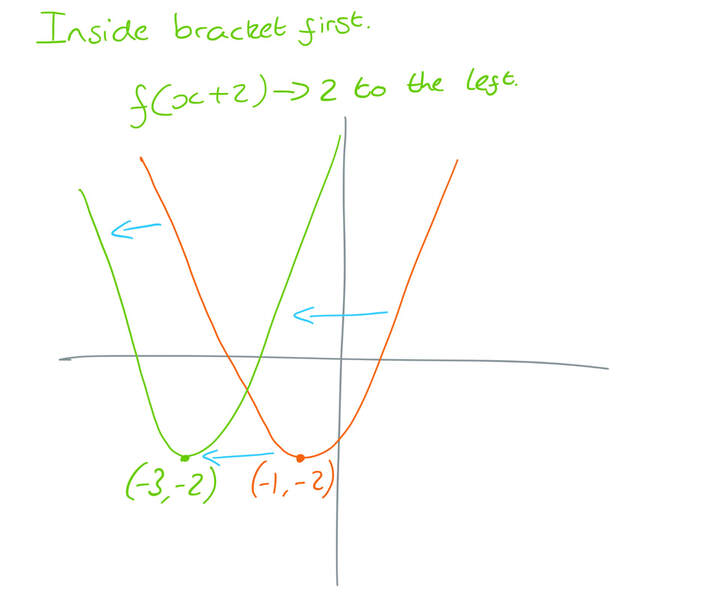
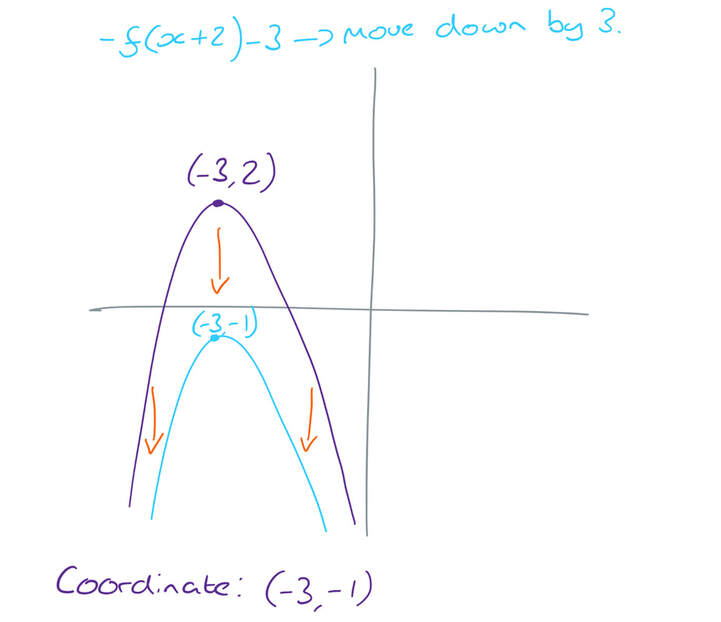
4) Coordinates (-3, -1)
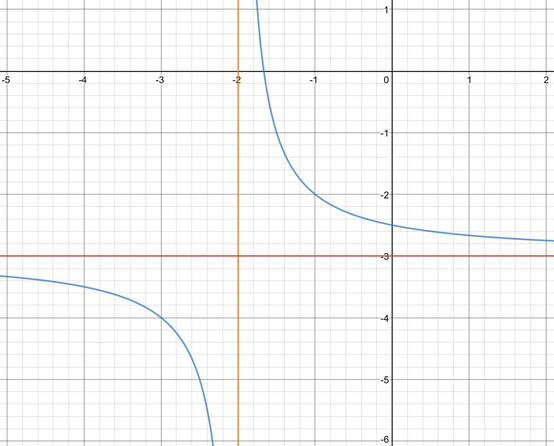
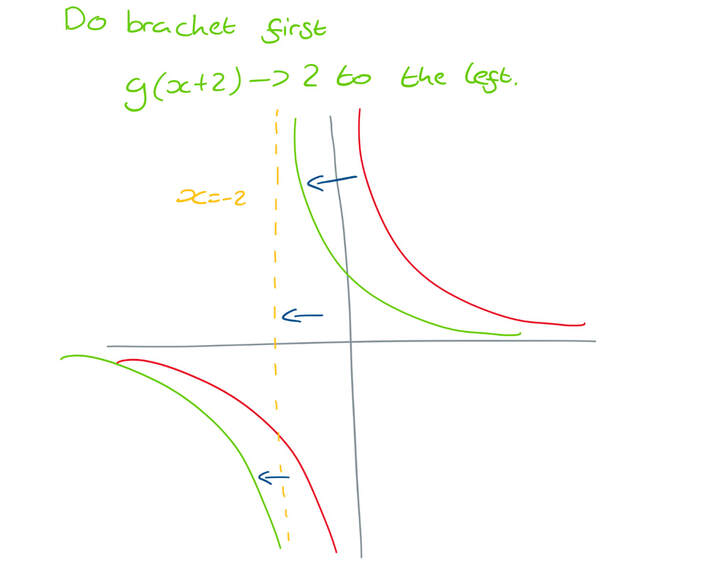
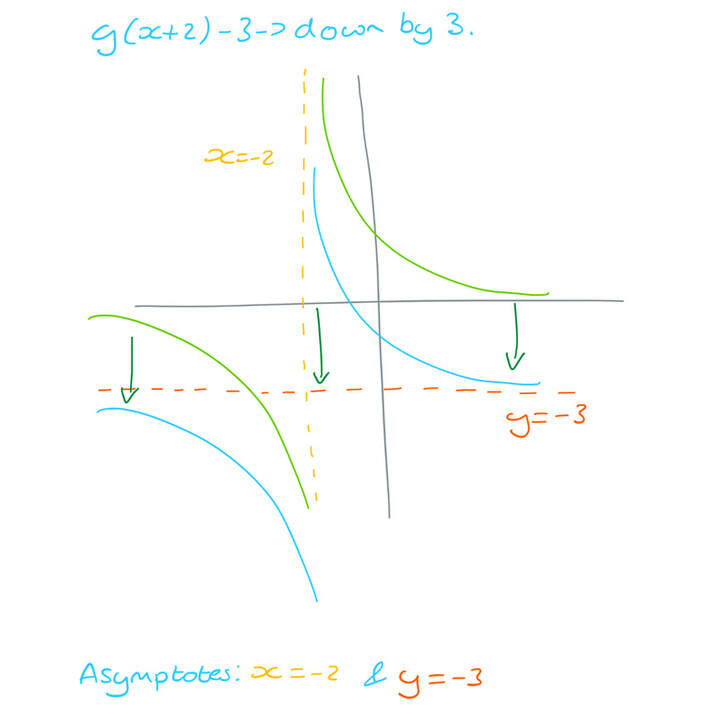
5) Asymptotes x = -2 (orange on the graph below) and y = -3 (red on the graph below)
Working
Questions
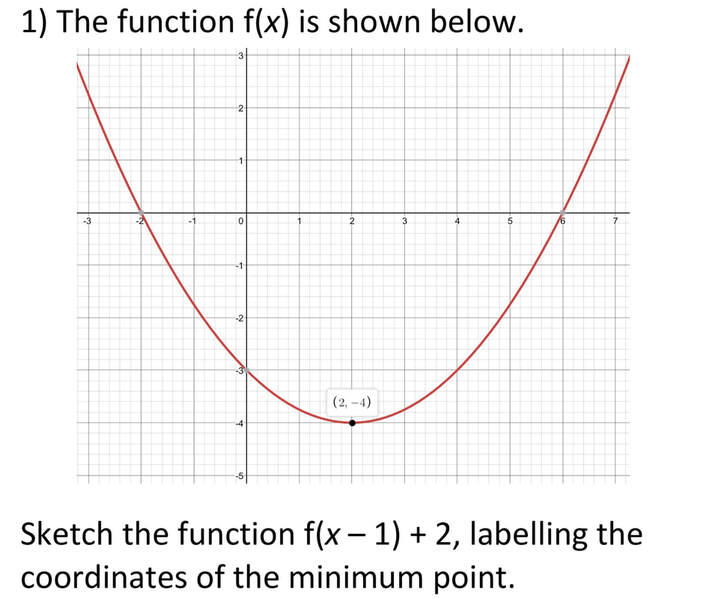
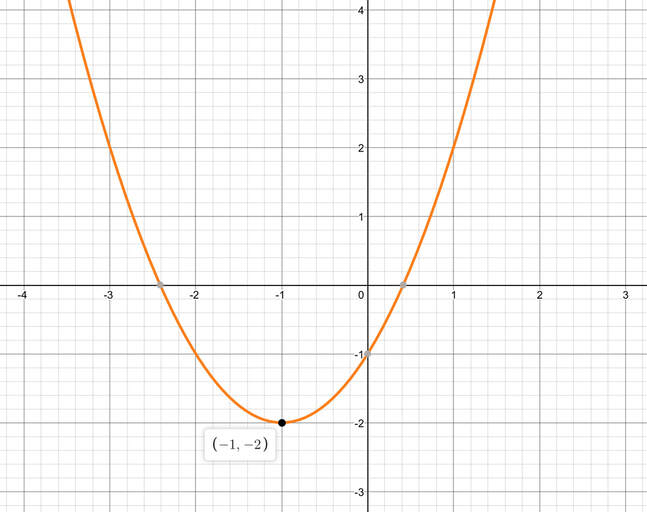
1) The graph below shows the function f(x).
1) The graph below shows the function f(x).
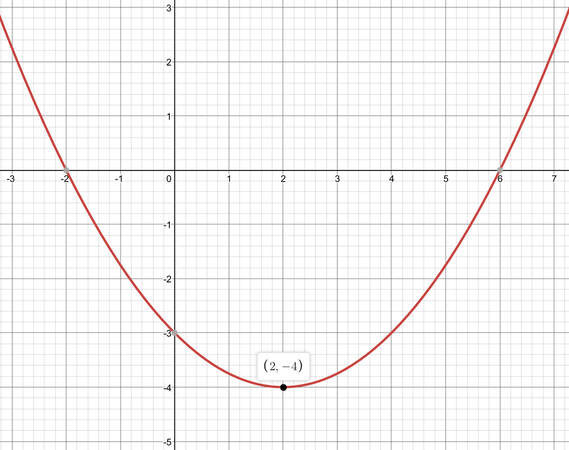
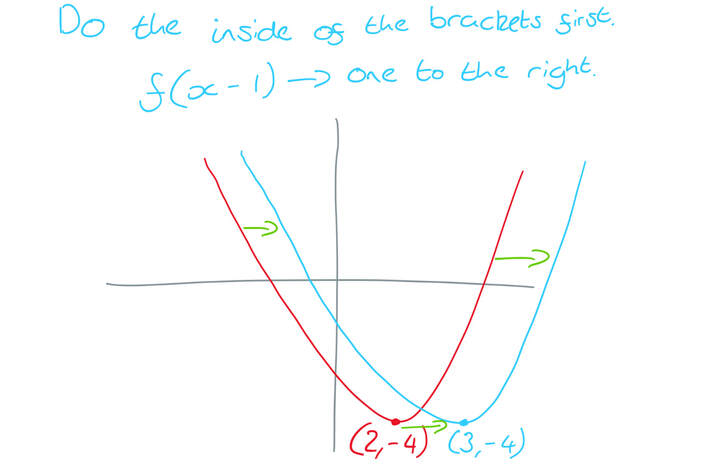
Sketch the function f(x – 1) + 2, labelling the coordinates of the minimum point.
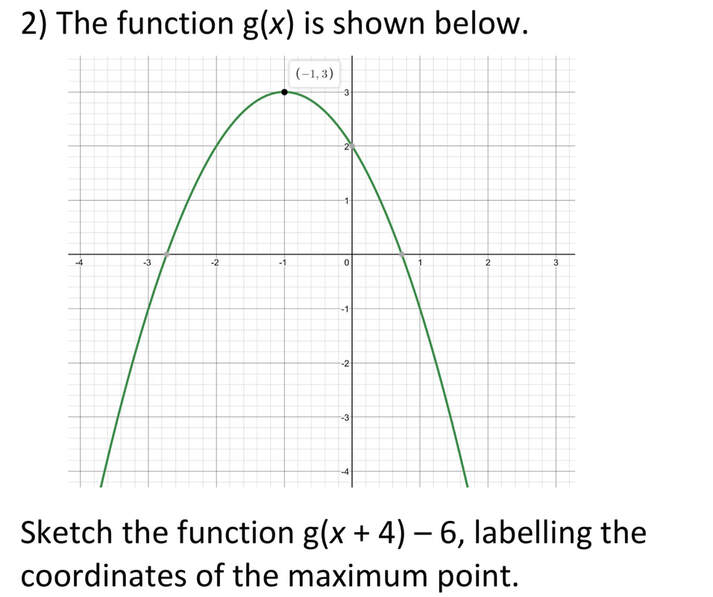
2) The function g(x) is shown below.
2) The function g(x) is shown below.
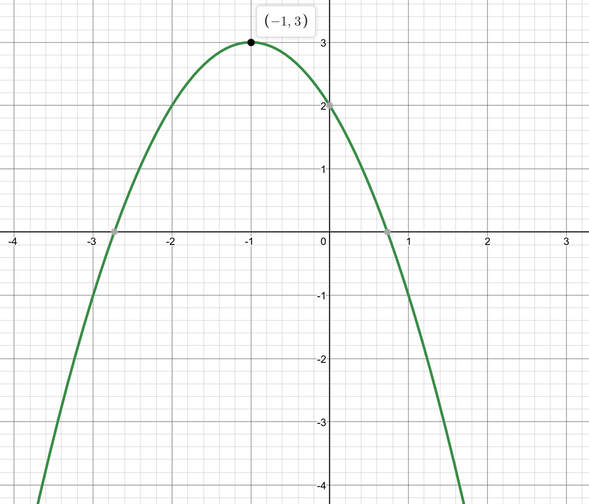
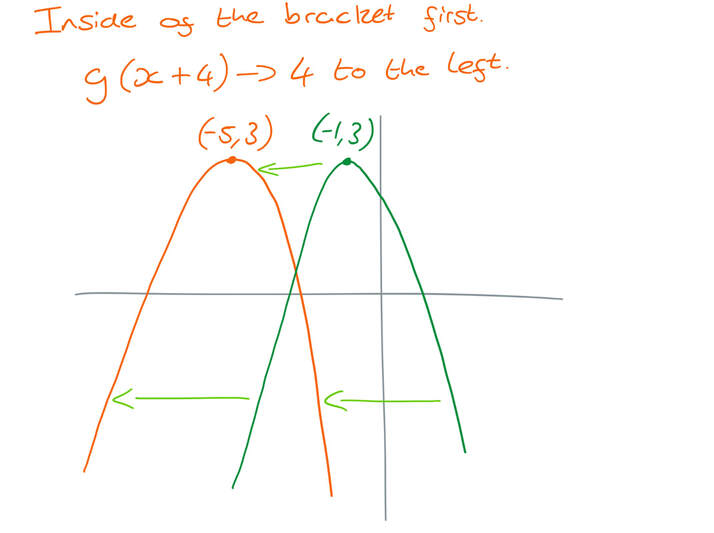
Sketch the function g(x + 4) – 6, labelling the coordinates of the maximum point.
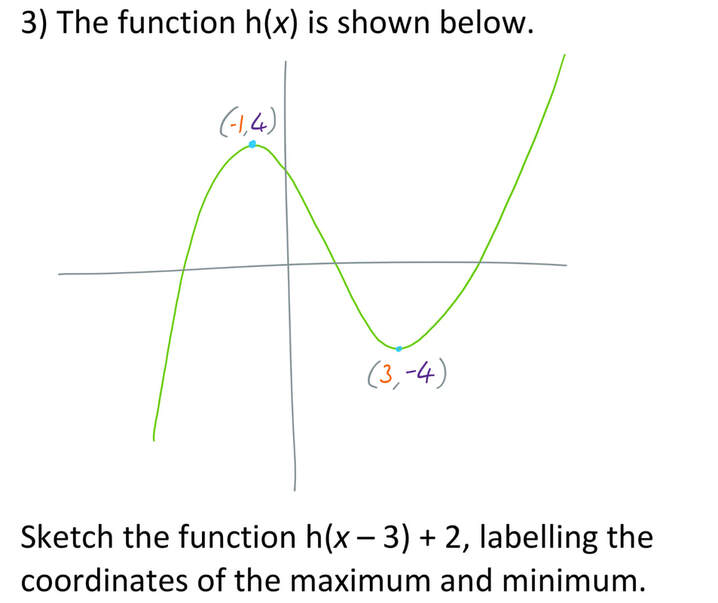
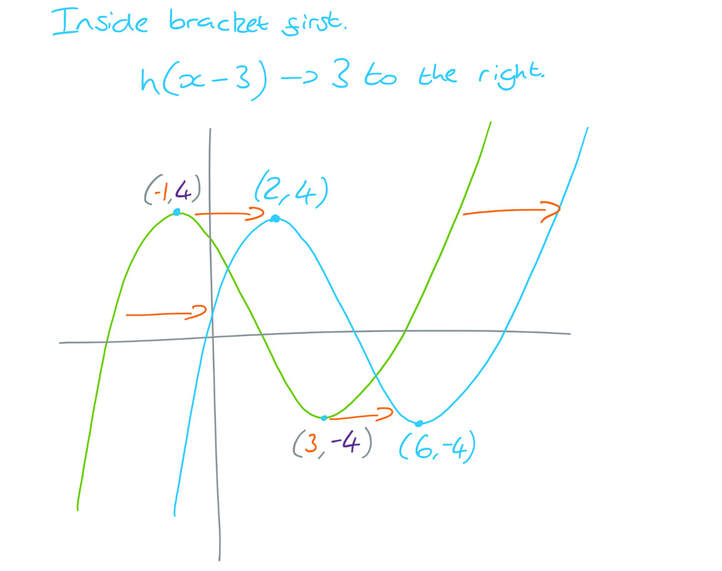
3) The function h(x) is shown below.
3) The function h(x) is shown below.
Sketch the function h(x – 3) + 2, labelling the coordinates of the maximum and minimum.
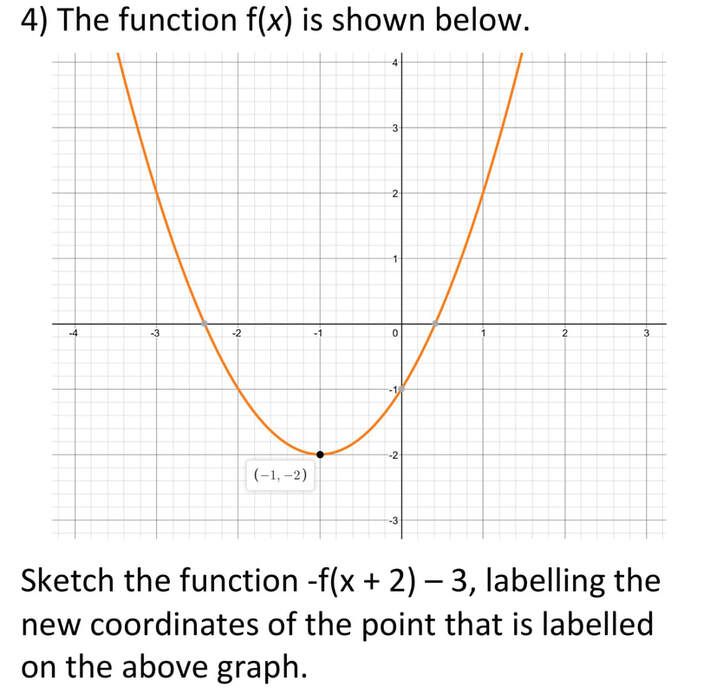
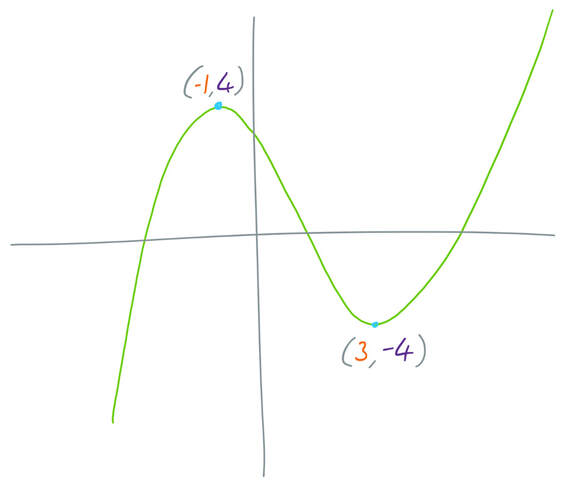
4) The function f(x) is shown below.
4) The function f(x) is shown below.
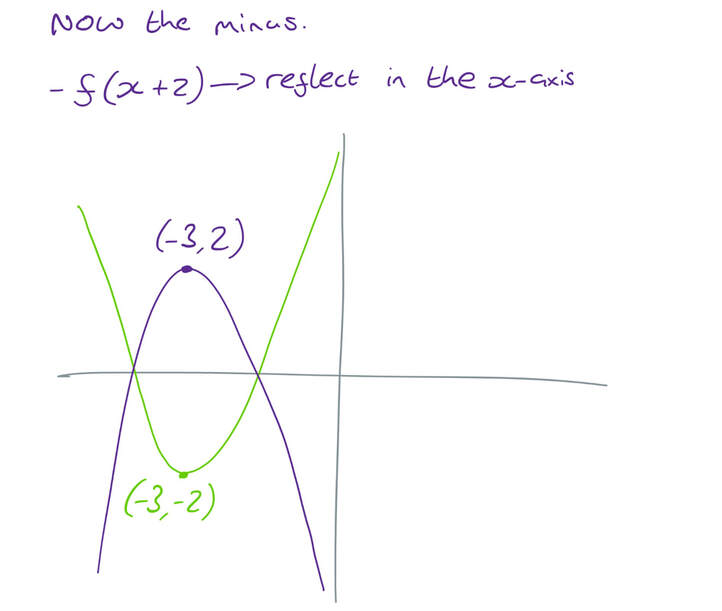
Sketch the function -f(x + 2) – 3, labelling the new coordinates of the point that is labelled on the above graph.
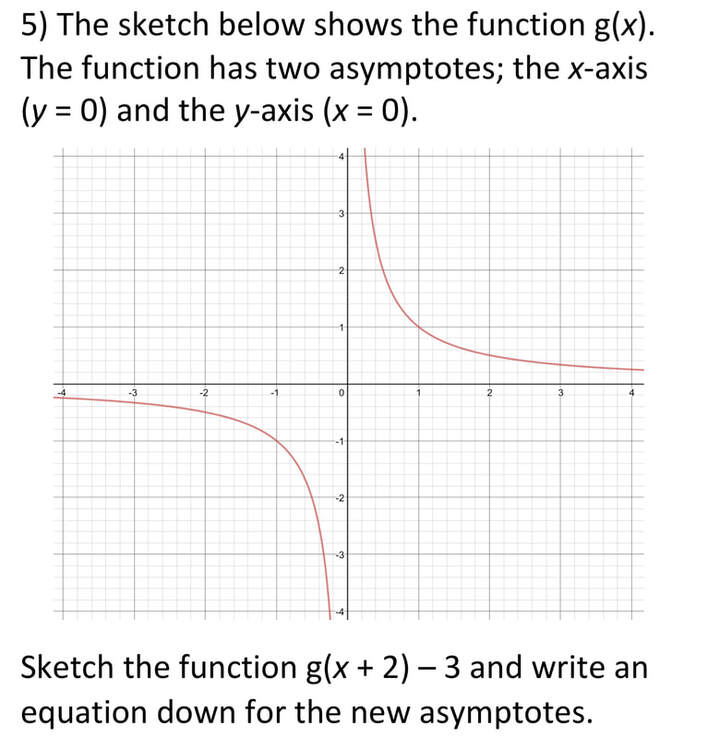
5) The sketch below shows the function g(x). The function has two asymptotes; the x-axis (y = 0) and the y-axis (x = 0).
5) The sketch below shows the function g(x). The function has two asymptotes; the x-axis (y = 0) and the y-axis (x = 0).
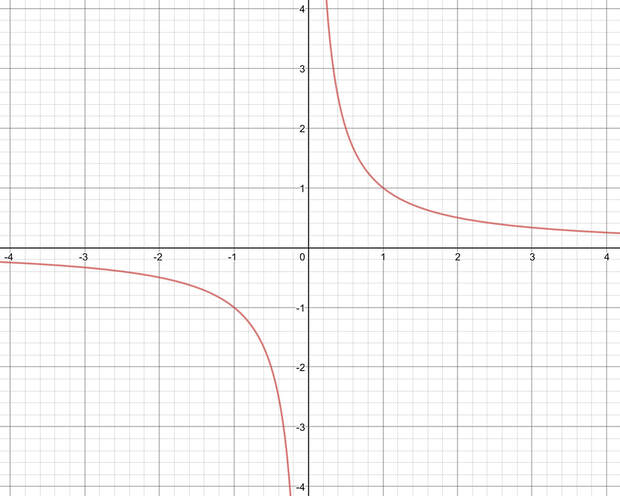
Sketch the function g(x + 2) – 3 and write an equation down for the new asymptotes.