Back to Edexcel Trigonometry (H) Home
Trigonometry: Quiz 5 – Answers
Trigonometry: Quiz 5 – Answers
Answers & Working
Part 1
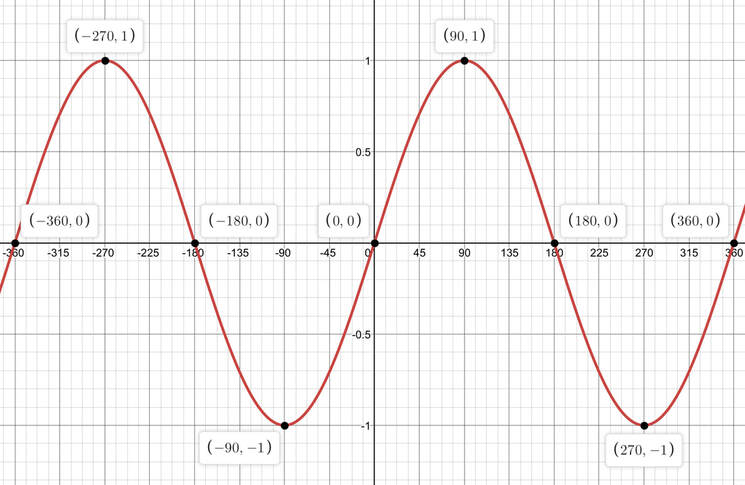
1)
Part 1
1)
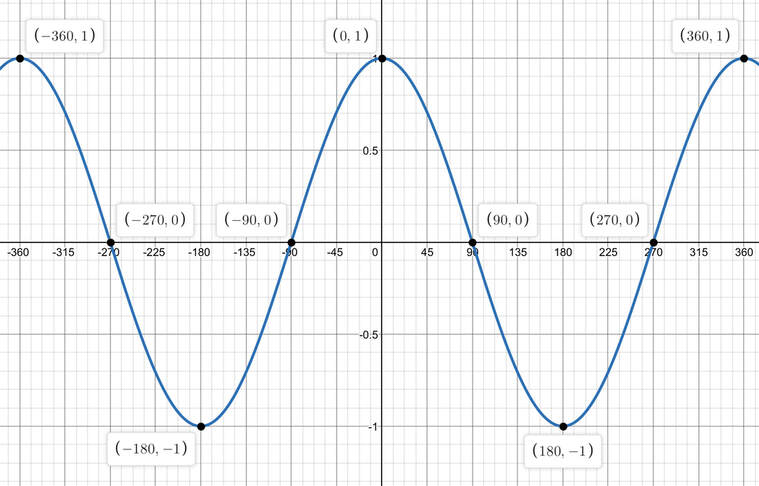
2)
3)
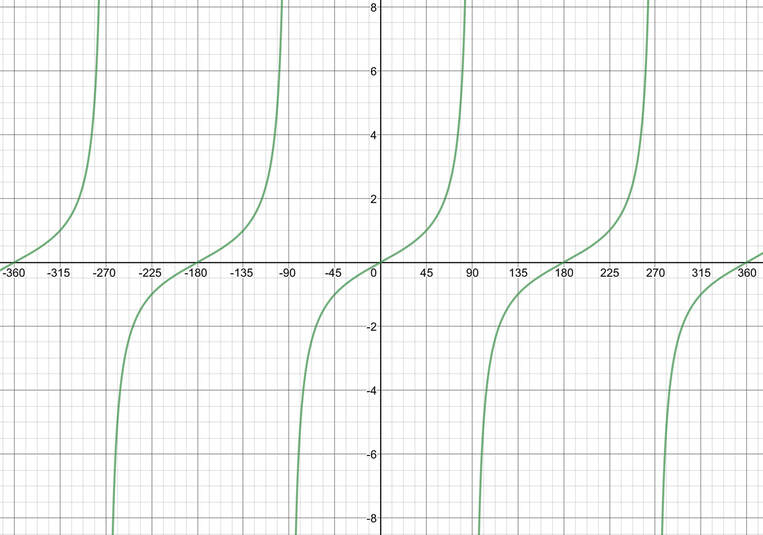
There are asymptotes at x = -270°, x = -90°, x = 90° and x = 270°
Part 2
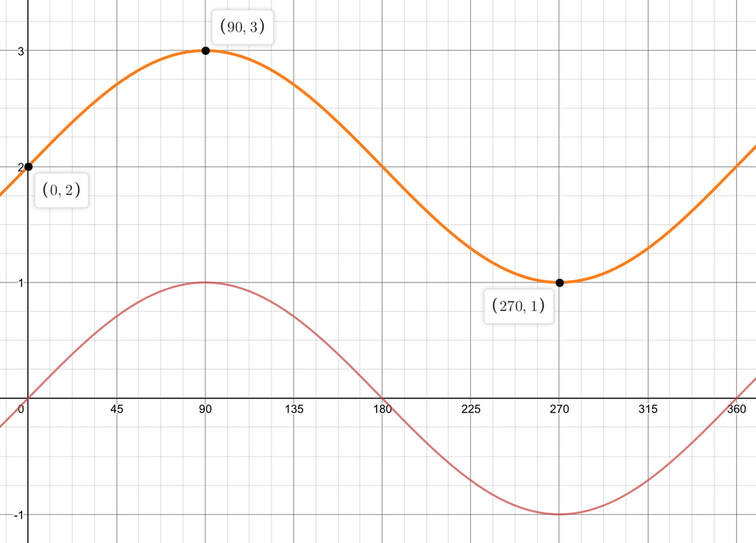
1) The 2 in y = 2 + sin(x) adds 2 to every single value of sin(x); the whole sin(x) curve moves up by 2.
The orange line is y = 2 + sin(x) and the green line is y = sin(x).
Part 2
1) The 2 in y = 2 + sin(x) adds 2 to every single value of sin(x); the whole sin(x) curve moves up by 2.
The orange line is y = 2 + sin(x) and the green line is y = sin(x).
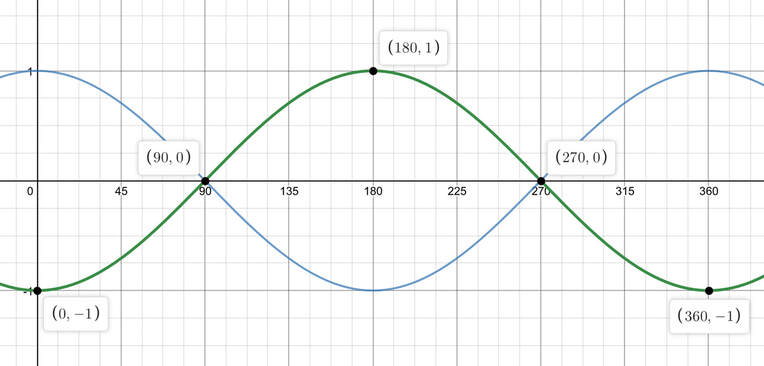
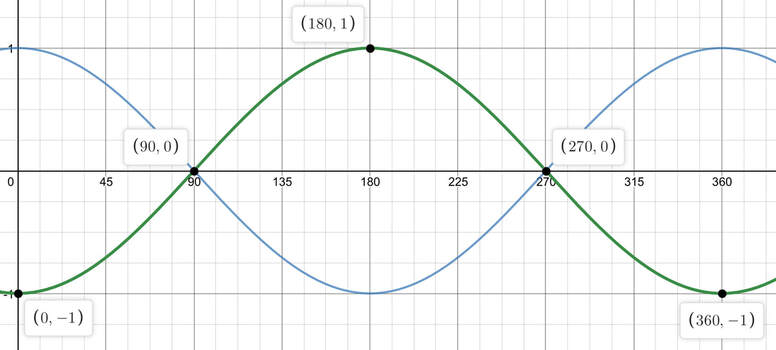
2) The negative in front of the cos in y = -cos(x) results in the values for cos(x) being the opposite sign; the whole cos(x) curve is reflected in the x axis.
The green line is y = -cos(x) and the blue line is y = cos(x).
The green line is y = -cos(x) and the blue line is y = cos(x).
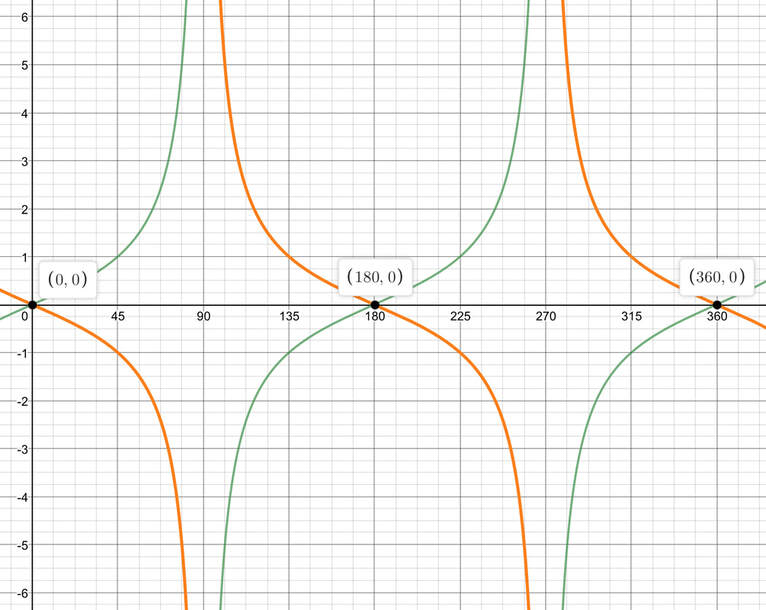
3) The negative in front of the tan in y = -tan(x) results in the values for tan(x) being the opposite sign; the whole tan(x) curve is reflected in the x axis.
The asymptotes are x = 90° and x = 270°
The orange line is y = -tan(x) and the green line is y = tan(x).
The asymptotes are x = 90° and x = 270°
The orange line is y = -tan(x) and the green line is y = tan(x).
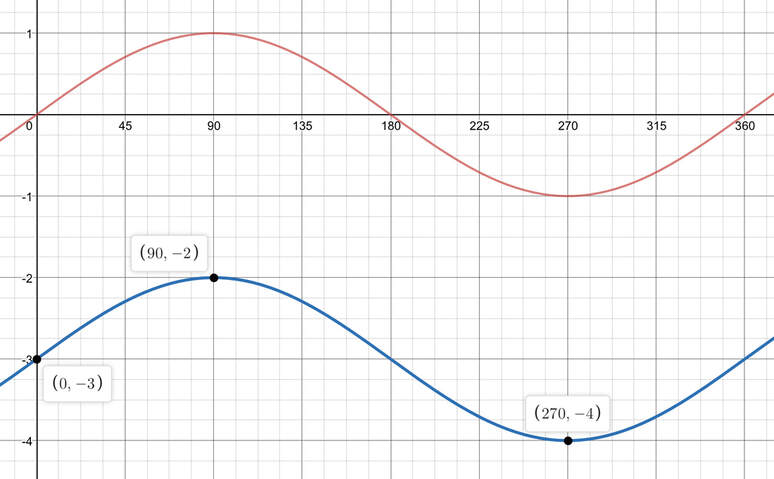
4) The –3 in y = sin(x) – 3 takes 3 from every single value of sin(x); the whole sin(x) curve moves down by 3.
The blue line is y = sin(x) – 3 and the red line is y = sin(x).
The blue line is y = sin(x) – 3 and the red line is y = sin(x).
5) The +90° inside the brackets for y = sin(x + 90°) shifts the curve 90° to the left (remember: adding inside the bracket moves the curve to the left, and taking inside the bracket moves the curve to the right).
The green line is y = sin(x + 90) – 3 and the red line is y = sin(x).
The green line is y = sin(x + 90) – 3 and the red line is y = sin(x).
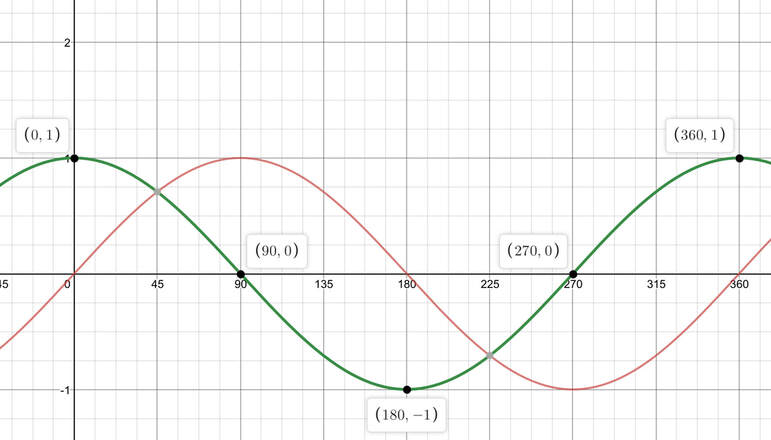
6) The –180° inside the brackets for y = cos(x – 180°) shifts the curve 180° to the right.
The green line is y = cos(x – 180) and the blue line is y = cos(x).
The green line is y = cos(x – 180) and the blue line is y = cos(x).
Questions
All of the question in this quiz are asking you to sketch graphs of trigonometry functions. When you are sketching the graphs, make sure that you label:
All of the question in this quiz are asking you to sketch graphs of trigonometry functions. When you are sketching the graphs, make sure that you label:
- All of the points where the graph crosses the coordinate axis
- The maximum and minimum values for sin and cos
- The asymptotes for tan
Part 1
1) Draw the graph of y = sin(x) for values x between -360° and 360°.
2) Draw the graph of y = cos(x) for values of x between -360° and 360°.
3) Draw the graph of y = tan(x) for values of x between -360° and 360°.
1) Draw the graph of y = sin(x) for values x between -360° and 360°.
2) Draw the graph of y = cos(x) for values of x between -360° and 360°.
3) Draw the graph of y = tan(x) for values of x between -360° and 360°.
Part 2
1) Draw the graph of y = 2 + sin(x) for values of x between 0° and 360°.
2) Draw the graph of y = -cos(x) for values of x between 0° and 360°.
3) Draw the graph of y = -tan(x) for values of x between 0° and 360°.
4) Draw the graph of y = sin(x) – 3 for values of x between 0° and 360°.
5) Draw the graph of y = sin(x + 90°) for values of x between 0° and 360°.
6) Draw the graph of y = cos(x – 180°) for values of x between 0° and 360°.