Back to Edexcel Pythagoras’ Theorem (H) Home
4.9 D) Length of a Line on a Graph
4.9 D) Length of a Line on a Graph
We are able to use Pythagoras’ theorem to work out the length of a line between two points (this can also be described as the distance between two points on a graph). We work out the length of a line between two points by creating a right-angled triangle with the 3 lengths of the triangle being:
Let’s have some examples.
- Hypotenuse – the length of the line/ the distance between the two points
- Side 1 – change in y
- Side 2 – change in x
Let’s have some examples.
Example 1
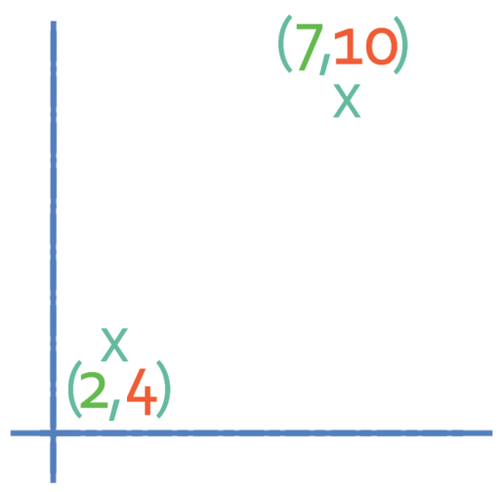
There are two points on a graph; point A and point B. Point A has the coordinates (2, 4) and point B has the coordinates (7, 10). What is the distance between the two points? Give your answer to one decimal place.
The best way to start this question is to do a little diagram showing where the two points are on a graph. The diagram is there to give you an understanding of what is happening, and this means that it does not have to be 100% accurate. It is so much harder to answer the question if we do not draw the graph out. Below is a sketch of the graph.
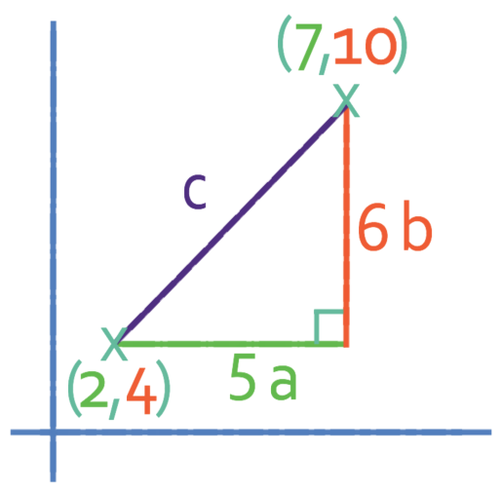
We are looking for the distance between points A and B. The distance between A and B is the hypotenuse for this triangle. The other two sides of the triangle are going to be the change in x (the bottom/ horizontal side) and the change in y (the right side/ vertical side).
We are able to work out the change in x by taking the smaller values away from the larger value. The smaller x value out of the two points is 2 and the larger x value out of the two points is 7. Therefore, we minus 2 from 7 and this gives us a change in x of 5 (7 – 2).
Similarly, we are able to work out the change in y by taking the smaller y value from the larger y value. The smaller y value out of the two points is 4 and the larger y value is 10. Therefore, we minus 4 from 10 and this gives us a change in y of 6 (10 – 4).
We now have the two lengths that are not the hypotenuse.
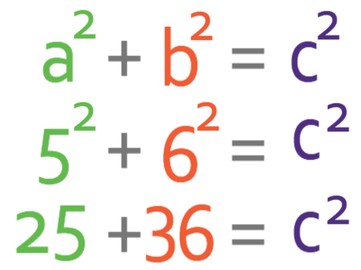
We are now able to work out the hypotenuse/ the distance between the two points. We know that according to Pythagoras’ theorem, the square of the hypotenuse is the sum of the squares of the other 2 sides. The change in x and the change in y will be a and b in the formula below; it does not matter which value is a and which value is b. I am going to have the change in x as a (a is 5) and the change in y as b (b is 6). c in the formula below is what we are looking for.
We want to find the value of c and not c2. Therefore, we need to square root both sides of the equation.
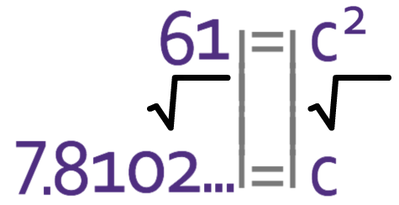
The final step is to round to 1 decimal place.

The distance between point A and point B is 7.8 units.
Example 2
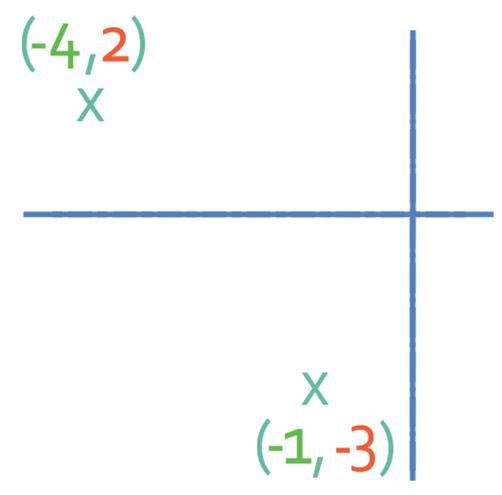
Point C is (-4, 2) and point D is (-1, -3). What is the distance between these two points? Give your answer to one decimal place.
Like before, the best way to start to answer this question is to roughly plot the two points on a graph.
Point C is (-4, 2) and point D is (-1, -3). What is the distance between these two points? Give your answer to one decimal place.
Like before, the best way to start to answer this question is to roughly plot the two points on a graph.
In order to find the distance between the two points, we will create a right-angled triangle. The hypotenuse of the triangle will be the distance between the two points and the other two sides in the right-angled triangle will be the change in x and the change in y.
We are able to work out the change in x by taking the smaller value away from the larger value. The smaller x value between the two points is -4 and the larger value is -1. Therefore, we take -4 from -1.
We are able to work out the change in x by taking the smaller value away from the larger value. The smaller x value between the two points is -4 and the larger value is -1. Therefore, we take -4 from -1.

We now work out the change in y in a similar way; we take the smaller y value (-3) from the larger y value (2).

We can add this information to the sketch that we made earlier.
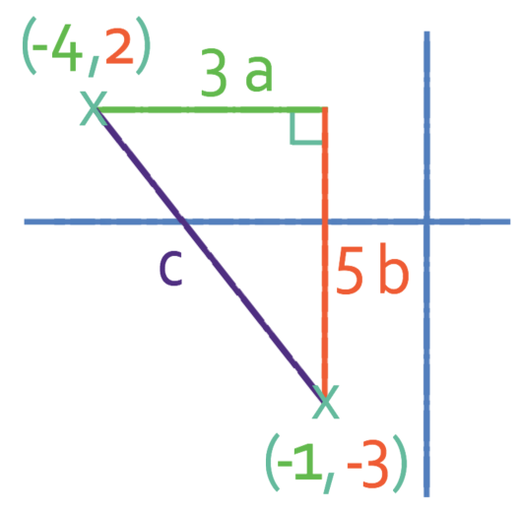
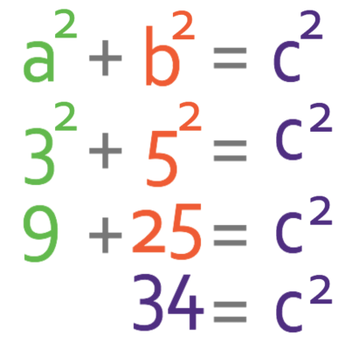
The next step is to use Pythagoras’ theorem to work out the hypotenuse/ the distance between the two points. The distance/ hypotenuse is c. It does not matter which out of the other two values is a and b. I am going to have the change in x as a (a is 3) and the change in y as b (b is 5).
We now need to square root both sides as we want to find c and not c2.
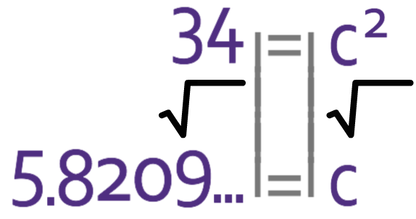
The final step is to round our answer to 1 decimal place.
The distance between point C and point D is 5.8 units.