Back to Edexcel Probability (H) Home
5 A) Probability Introduction
5 A) Probability Introduction
Probability tells us how likely it is for an event to happen. We are able to describe probability in a few different ways.
One way that we can describe probability is through words. We can say that an event could be impossible, unlikely, even chance, likely or certain. Here is a definition of impossible, certain and even chance:
Another way that we can represent probabilities is to use numbers. We can use fractions or decimals. Fractions and decimals must have a value between 0 and 1 (we can never have a value that is greater than 1 or negative). The closer the value of the fraction or decimal is to 1, the more likely it is that the event will occur. On the contrary, the closer the value of the fraction or decimal is to 0, the less likely it is that the event will occur.
We are also able to use percentages for probability and the probability value needs to be between 0% and 100% (we can never have a probability above 100% and the value can never be a negative percentage). The closer the percentage is to 100%, the greater the chance is of the event occurring. The lower the percentage is, the less likely the event is to occur.
The diagram shows the three different numerical values for probability that are equivalent to each other and the word that can describe the events.
One way that we can describe probability is through words. We can say that an event could be impossible, unlikely, even chance, likely or certain. Here is a definition of impossible, certain and even chance:
- A probability of impossible means that the event will never occur.
- A probability of certain means that an event will definitely occur.
- Even chance means that there is the same chance of the event occurring as the event not occurring. For example, the probability of getting a head when flipping a coin can be described as even because there is the same chance of getting a head and not getting a head.
Another way that we can represent probabilities is to use numbers. We can use fractions or decimals. Fractions and decimals must have a value between 0 and 1 (we can never have a value that is greater than 1 or negative). The closer the value of the fraction or decimal is to 1, the more likely it is that the event will occur. On the contrary, the closer the value of the fraction or decimal is to 0, the less likely it is that the event will occur.
We are also able to use percentages for probability and the probability value needs to be between 0% and 100% (we can never have a probability above 100% and the value can never be a negative percentage). The closer the percentage is to 100%, the greater the chance is of the event occurring. The lower the percentage is, the less likely the event is to occur.
The diagram shows the three different numerical values for probability that are equivalent to each other and the word that can describe the events.
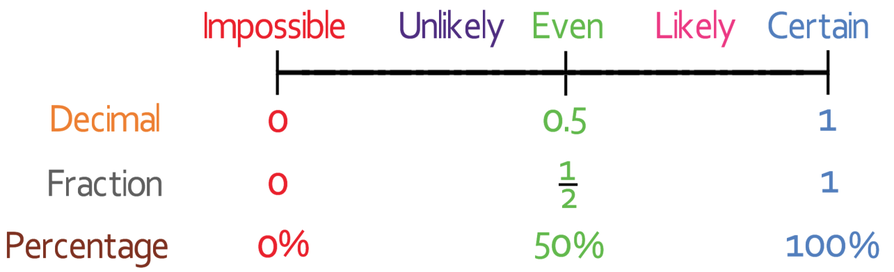
An event that will never occur can be described as impossible. It will have a decimal probability of 0, a fraction probability of 0 and a percentage probability of 0%. It does not matter how we describe the probability of an event occurring because all of the values for impossible on the diagram are equal to one another (we can use decimals, fractions or percentages). However, you just need to make sure that you give the probability in the units that the question asks you for (for example, sometimes you will be asked to give the probability as a decimal, and then other times you may be asked to give the probability as a percentage or a fraction).
An event that is definitely going to happen can be described in word form as certain, in decimal form as 1, in fraction form as 1 and in percentage form as 100%.
An event that has an event chance of occurring will have a probability of 0.5 (decimal form), ½ (fraction form) or 50% (percentage form). An example of an event that has an even chance of occurring is rolling a dice and getting an even number.
An event that has a probability that is less than 0.5 (decimal form), ½ (fraction form) or 50% (percentage form) can be described as unlikely, which means that the event is more likely to not occur than occur. An example would be the probability of rolling a 3 on a fair dice; it is more likely that you will not roll a 3 than you will roll a 3.
An event that has a probability that is greater than 0.5 (decimal form), ½ (fraction form) or 50% (percentage form) can be described as more likely to occur than to not occur. An example of an event that is more likely to occur than not occur is that it will rain in December in the UK.
Plotting on a Probability line
You may be asked in the exam to plot the probability of an event occurring on a probability number line. We answer questions like this by working out which of the 5 probabilities the event falls into. The 5 probabilities are impossible, unlikely, even chance, likely and certain.
Let’s have an example.
Example 1
I have a fair normal 6-sided dice. Mark on the probabilities of the following events occurring on the probability line below:
- Rolling a 1
- Rolling an odd number
- Rolling a 15
- Rolling a number less that 8

Part 1
The first part asks us to mark on the probability of rolling a 1. There are 6 numbers on a dice and only one of the numbers is a 1. Therefore, it is quite unlikely that I will roll a 1. This means that the mark for rolling a 1 will be on the unlikely part of the number line.
The first part asks us to mark on the probability of rolling a 1. There are 6 numbers on a dice and only one of the numbers is a 1. Therefore, it is quite unlikely that I will roll a 1. This means that the mark for rolling a 1 will be on the unlikely part of the number line.

Part 2
The second part asks us to mark on the probability of rolling an odd number. 3 out of 6 of the numbers on a dice are odd (1, 3 and 5). This means that the probability of rolling an odd number is a half/ evens, which means that the mark for part 2 will be in the middle of the probability line.
The second part asks us to mark on the probability of rolling an odd number. 3 out of 6 of the numbers on a dice are odd (1, 3 and 5). This means that the probability of rolling an odd number is a half/ evens, which means that the mark for part 2 will be in the middle of the probability line.

Part 3
The third part asks us to mark on the probability of rolling a 15. The numbers on the dice only go up to 6. Therefore, none of the numbers on the dice are 15 and this means that it is impossible to roll the dice and get a 15. Impossible on the probability line is where 0 is.
The third part asks us to mark on the probability of rolling a 15. The numbers on the dice only go up to 6. Therefore, none of the numbers on the dice are 15 and this means that it is impossible to roll the dice and get a 15. Impossible on the probability line is where 0 is.

Part 4
The final part asks us to mark on the probability of rolling a number that is less than 8. All of the numbers on a fair dice are less than 8 and this means that it is certain that you will roll a number that is less than 8. Certain on the probability line is where 1 is.
The final part asks us to mark on the probability of rolling a number that is less than 8. All of the numbers on a fair dice are less than 8 and this means that it is certain that you will roll a number that is less than 8. Certain on the probability line is where 1 is.