Back to Edexcel Representing Data (H) Home
6.2 L) Cumulative Frequency Graphs – Part 3
6.2 L) Cumulative Frequency Graphs – Part 3
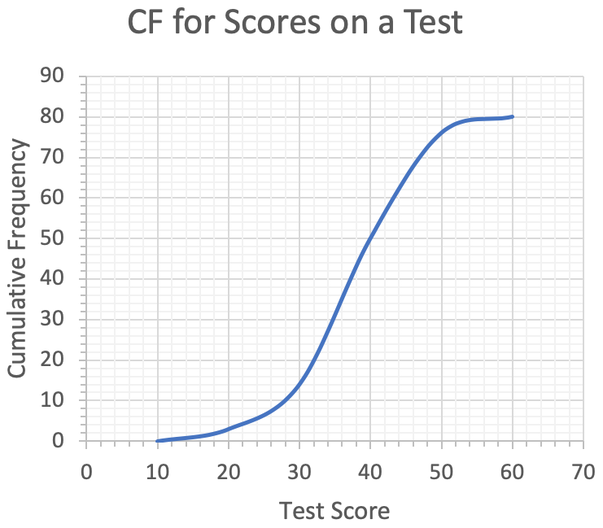
We are going to use the same cumulative frequency graph as the example in the previous section. The cumulative frequency graph is shown below. Click here here for a printable version of the cumulative frequency graph.
- Estimate the number of individuals who got more than 45 marks.
- The bottom 20% of students had to redo the test. Estimate the highest mark that still required a student to redo the test.
Part 1
Part 1 asks us to estimate the number of individuals who got more than 45 marks. The first step in answering this part is to find out how many individuals got 45 marks or less. We are able to find this out by finding 45 marks on the x-axis, reading up to the cumulative frequency curve and then across to the cumulative frequency. The working is shown on the graph below.
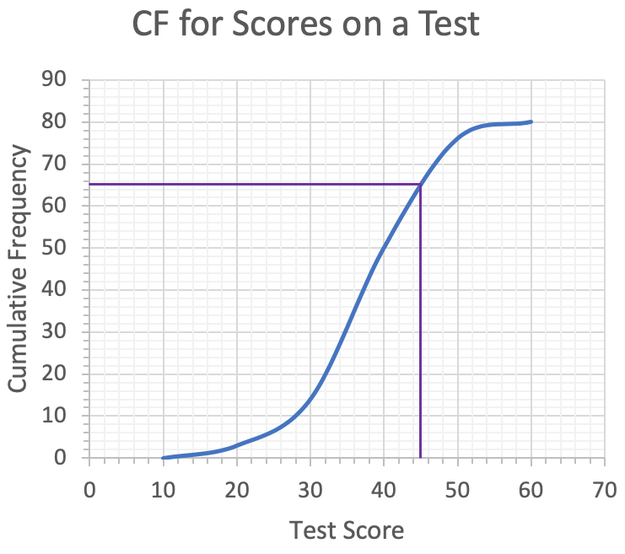
From the graph, we can see that 65 individuals got 45 marks or less. However, we want to know the number of individuals that got more than 45 marks. We are able to find this out by taking 65 from the total number of individuals sitting the test, which is 80.

Therefore, 15 students got more than 45 marks on the test.
Part 2
Part 2 say that the bottom 20% of students were required to redo the test. Estimate the highest mark that still required you to redo the test.
There were 80 individuals that took the test and 20% of individual had to redo the test. The easiest way to find what 20% of 80 is, is to find out what 10% is first, which we do by dividing by 10. We then double (multiply by 2) the value to find what 20% is.
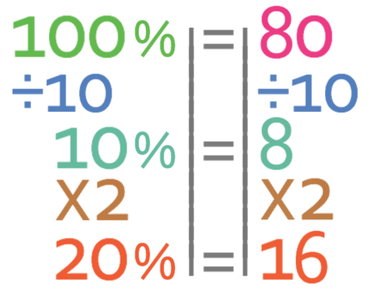
Therefore, 16 individuals in the class had to redo the test. We are able to find the highest mark that requires you to redo the test by finding 16 on the cumulative frequency axis (the y-axis), reading across to the cumulative frequency curve and then reading down to the mark. This is shown on the graph below.
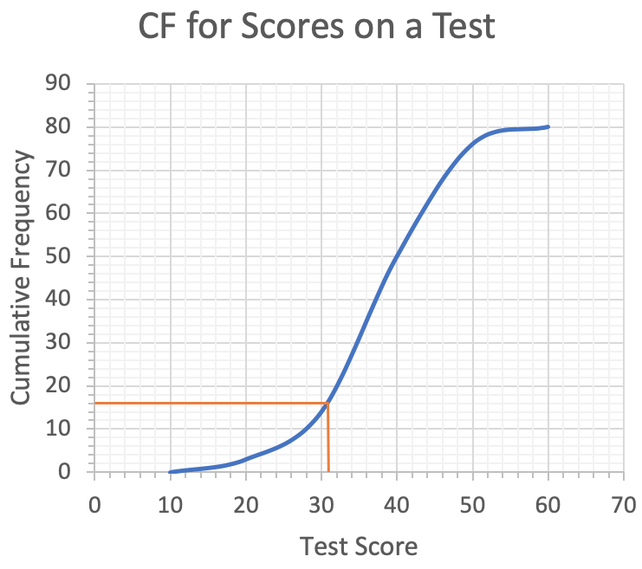
From the working above, we can see that the highest mark that still requires you to redo the test is 31.