Back to Edexcel Analysing Data (H) Home
6.3 A) Introduction & Mean
6.3 A) Introduction & Mean
When we are analysing different data sets, there are a few different averages that we are able to work out from the data. Here is a quick summary of the different averages and what they mean (we will be looking at what they mean in more detail later on in this section and the next sections):
- Mean – this is the mostly commonly used average and it is obtained by adding up all of the numbers in the data set together and dividing by the amount of numbers/ observations/ values in the data set.
- Median – the middle number in the data set. The easiest way to obtain the median is to order the numbers and then find the middle value.
- Mode – this is the most common value/ option that occurs in the data set. The easiest way to remember that the mode is the most common value is to remember that the first two letters in MOde and MOst frequent are MO.
- Range – this shows us how spread out the data is. It is the difference between the largest and smallest value.
Mean
This is the most commonly used average. We obtain the means by using the following equation:
This is the most commonly used average. We obtain the means by using the following equation:

Let’s have an example and we are going to be using this example to find out all of the above averages in this section and the next few sections.
Example 1
The data below shows the number of points that a basketball player scored in his last 9 games. What is the mean number of points that he scored per game?
The data below shows the number of points that a basketball player scored in his last 9 games. What is the mean number of points that he scored per game?

We use the formula above to work out the mean number of points that this basketball player scored per game.
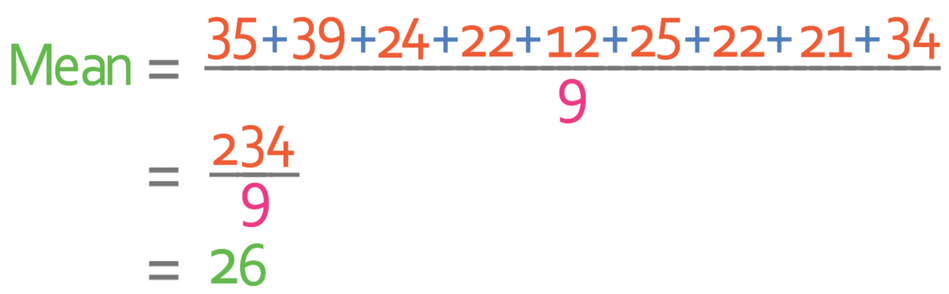
The mean number of points that our basketball player scored per game is 26.