Back to Edexcel Analysing Data (H) Home
Analysing Data: Quiz 3 - Answers
Analysing Data: Quiz 3 - Answers
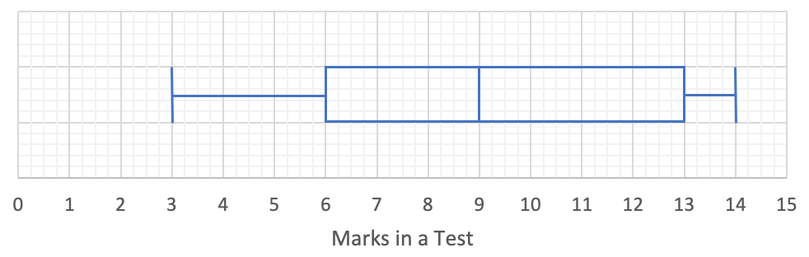
1)
a) 11
b) 9
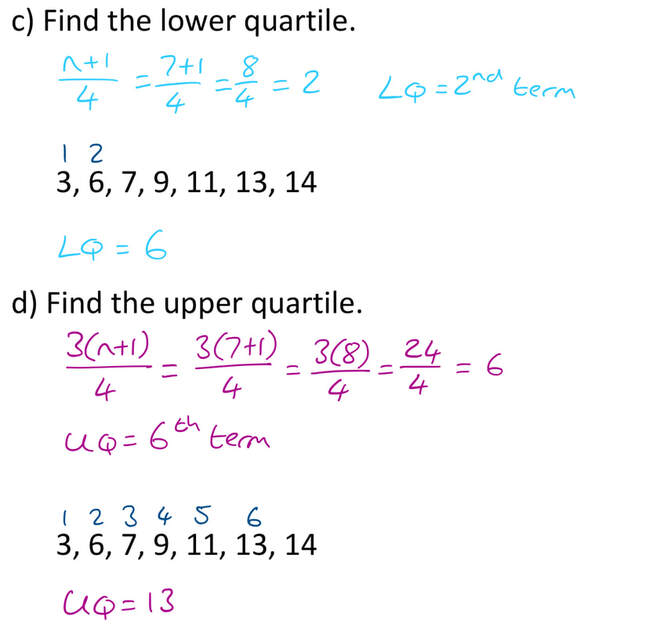
c) 6
d) 13
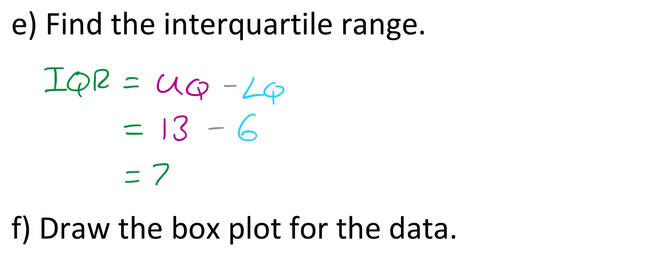
e) 7
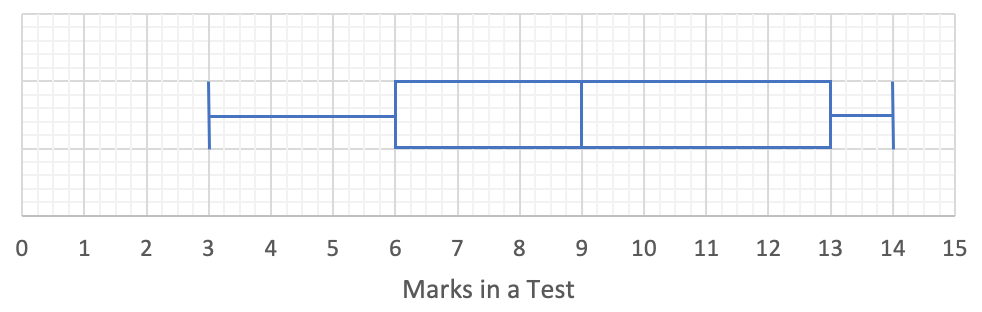
f)
a) 11
b) 9
c) 6
d) 13
e) 7
f)
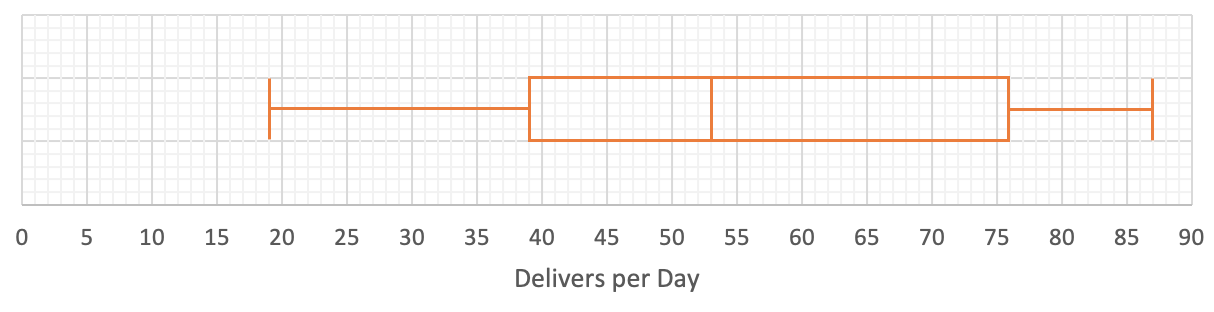
2)
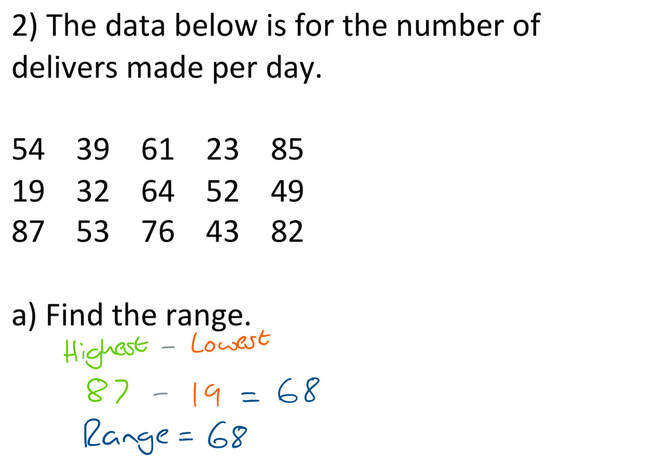
a) 68
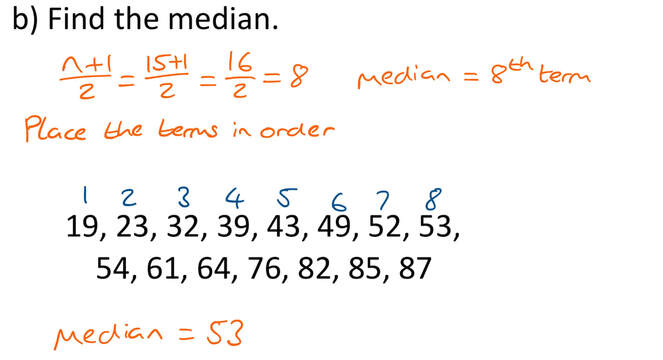
b) 53
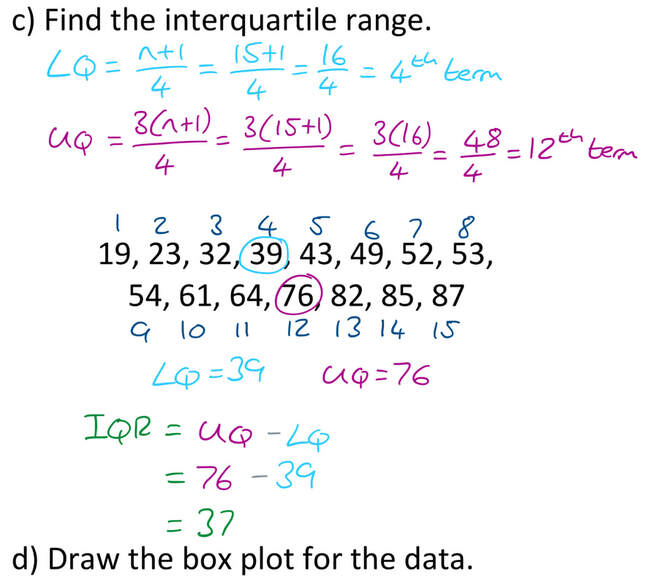
c) 37
d)
a) 68
b) 53
c) 37
d)
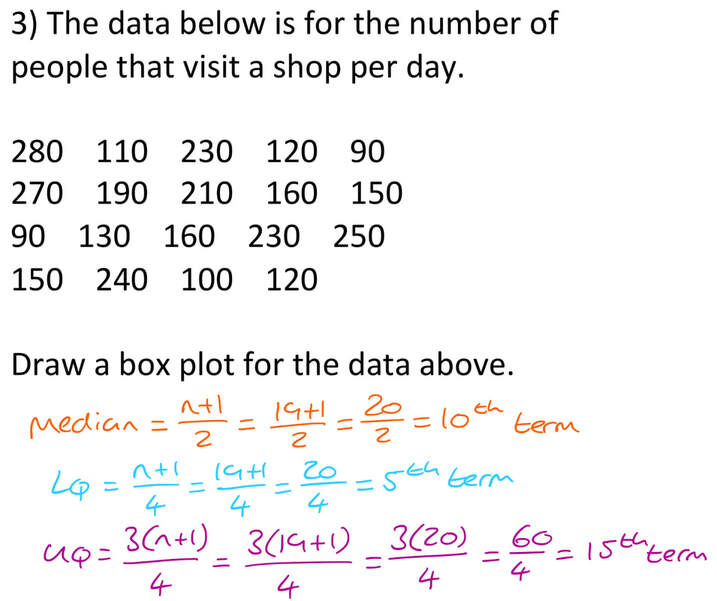
3)
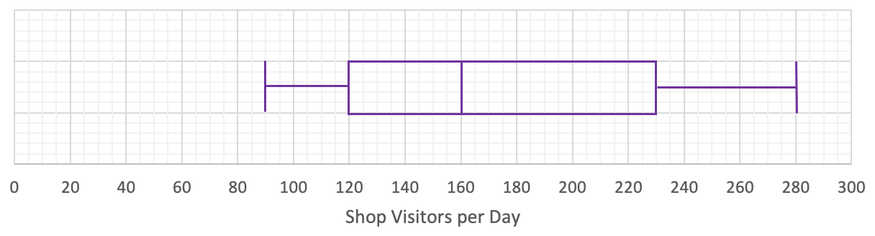
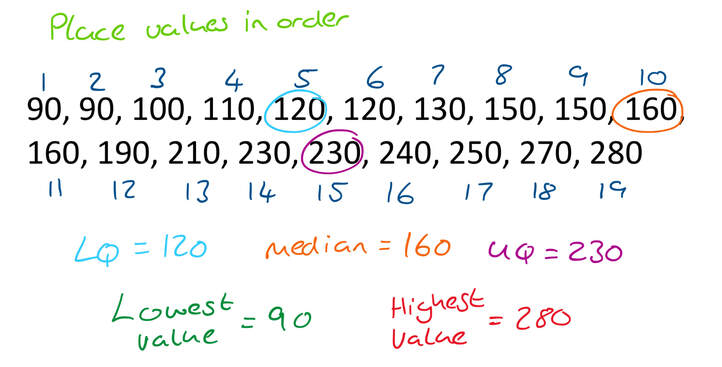
These are the important values for the box plot.
Lowest value = 90
LQ = 120
Median = 160
Upper Quartile = 230
Highest value = 280
Lowest value = 90
LQ = 120
Median = 160
Upper Quartile = 230
Highest value = 280
Working


Questions
Click here for a printable version of the data and an empty graph for the box plots.
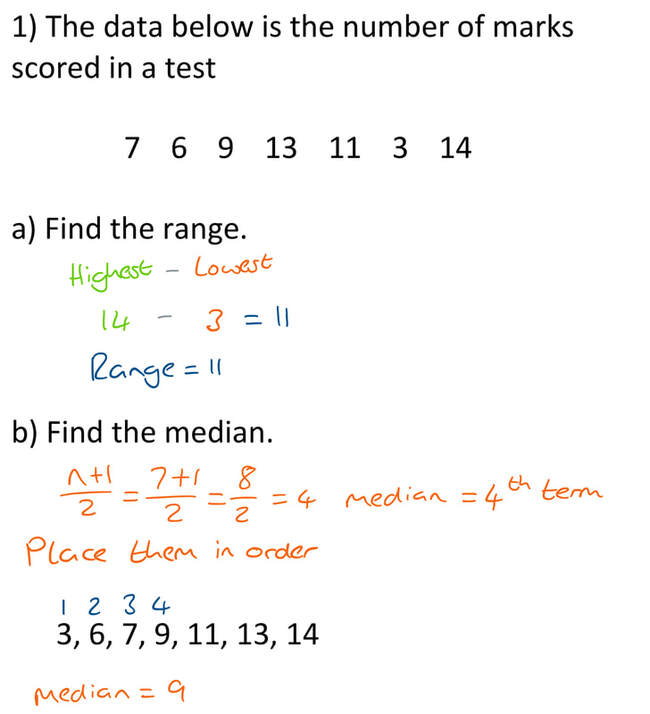
1) The data below is the number of marks scored in a test.
Click here for a printable version of the data and an empty graph for the box plots.
1) The data below is the number of marks scored in a test.
7 6 9 13 11 3 14
a) Find the range.
b) Find the median.
c) Find the lower quartile.
d) Find the upper quartile.
e) Find the interquartile range.
f) Draw the box plot for the data.
2) The data below is for the number of delivers made per day.
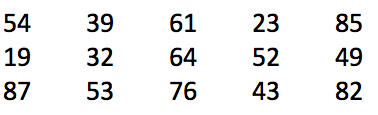
a) Find the range.
b) Find the median.
c) Find the interquartile range.
d) Draw the box plot for the data.
3) The data below is for the number of people that visit a shop per day.
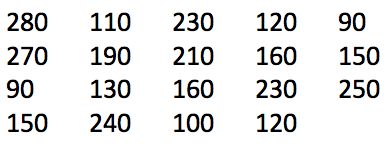
Draw a box plot for the data above.