Paper 1 Higher - Sample Assessment Q21 Answers
21) Here is a speed-time graph for a car journey.
The journey took 100 seconds.
The journey took 100 seconds.
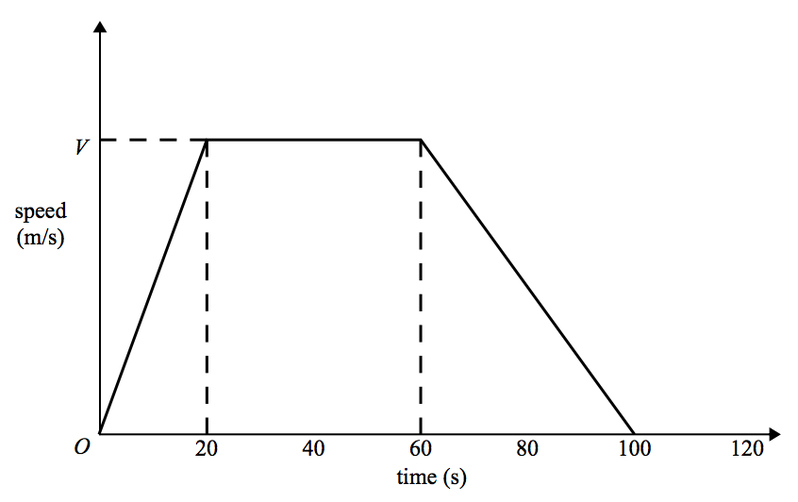
The car travelled 1.75km in the 100 seconds.
(a) Work out the value of V.
(3 marks)
(b) Describe the acceleration of the car for each part of this journey.
(2 marks)
(Total for Question 21 is 5 marks)
(a) Work out the value of V.
(3 marks)
(b) Describe the acceleration of the car for each part of this journey.
(2 marks)
(Total for Question 21 is 5 marks)
Answers
Question |
Answer |
Notes |
21 a |
25 |
C1 - For interpretation eg. area equated to 1750m P1 - Process to solve equation A1 |
21 b |
Discription |
C1 - Start to interpret graph eg. describe or give acceleration for one stage of the journey or state that acceleration is constant in all 3 parts C1 - Describe acceleration for all stages of the journey or give acceleration for all 3 stages (1.25 m/s^2 ; 0 m/s^2 ; –0.625 m/s^2) |