Paper 2 Higher - Sample Assessment Q19
19) The graph of y = f(x) is shown on both grids below.
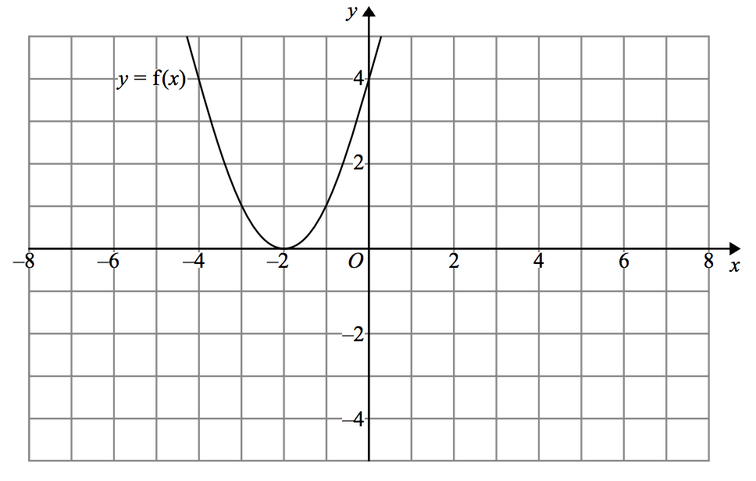
(a) On the grid above, sketch the graph of y = f(–x)
(1 mark)
(1 mark)
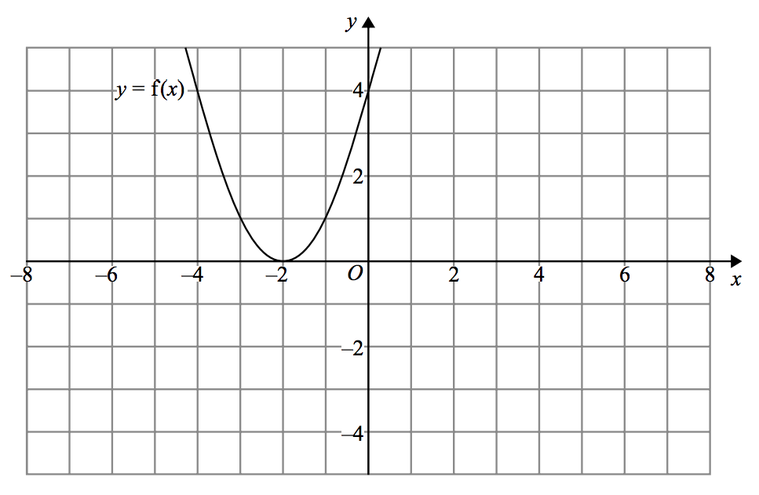
(b) On this grid, sketch the graph of y = –f(x) + 3
(1 mark)
(Total for Question 19 is 2 marks)
(1 mark)
(Total for Question 19 is 2 marks)