Back to OCR Simultaneous Equations (F) Home
2.4 C) Linear Simultaneous Equations: Graphical Method
2.4 C) Linear Simultaneous Equations: Graphical Method
Another method that can be used to solve simultaneous equations is to plot them both graphically. The solutions for x and y will be the point whereby the two lines intersect one another. We can use this method for both linear and quadratic simultaneous equations. In this section, we will be using the graphical method to solve linear simultaneous equations. In a later section, we will be using the graphical method to solve quadratic simultaneous equations.
Example 1
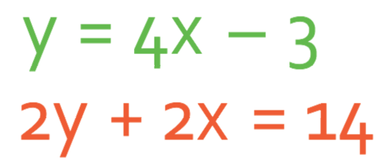
Find the values of x and y by solving the simultaneous equations graphically.
Find the values of x and y by solving the simultaneous equations graphically.
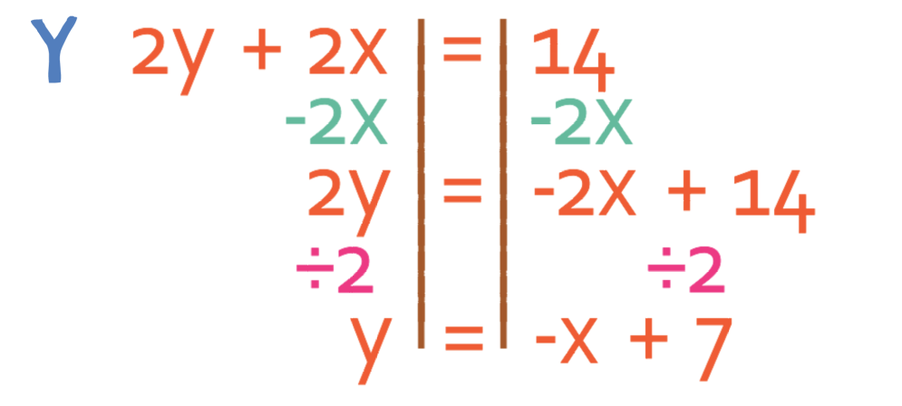
The easiest way to plot graphs is to turn them into the form y = mx + c (where m is the gradient and c is the y intersect). The first equation is already in this form, which means there is no need to modify this equation. However, the second equation is not in this form. We turn it into this form by making y the subject of the equation. The working is shown below.
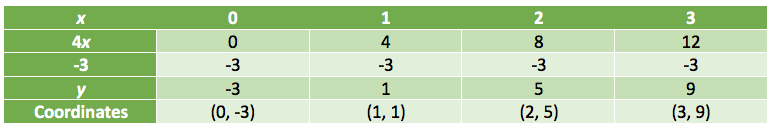
Both of the equations are now in the y = mx + c form making them easy to plot. The two equations and the tables are:
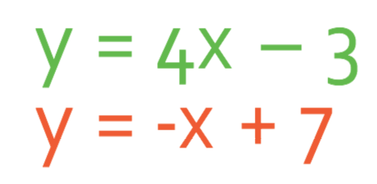
The two equations and the tables are:
y = 4x – 3
y = 4x – 3
y = -x + 7
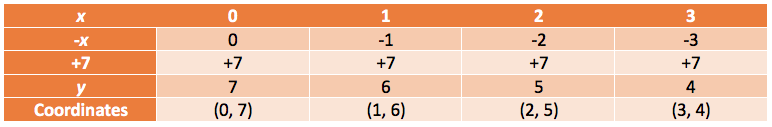
We can now plot these two lines onto a graph and find the coordinates of the point/ points where the lines intersect one another.
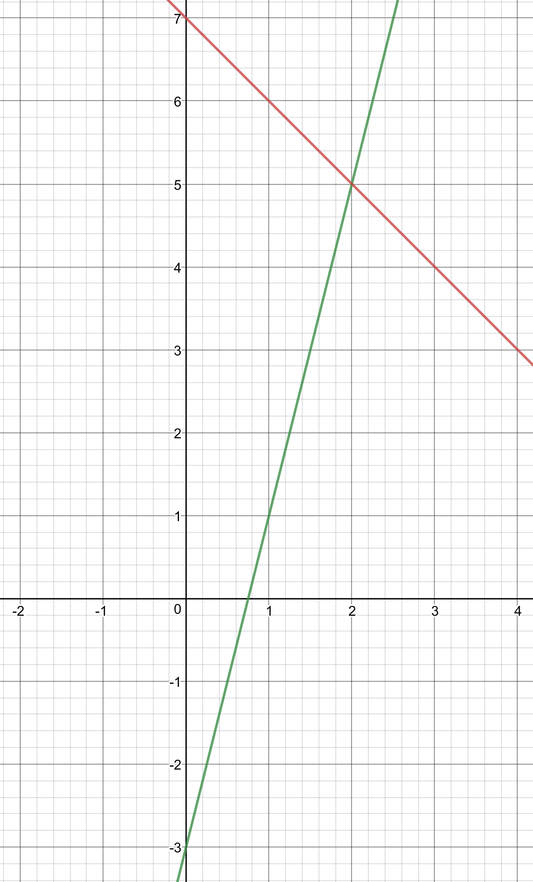
The green line has the equation y = 4x – 3. The blue line has the equation 2y + 2x = 14 (or y = -x + 7)
The solution for these two equations is where the lines intersect one another. The two lines intersect at the point (2, 5). Therefore, the value for x is 2 and the value for y is 5.
Example 2
Find the values for x and y for the simultaneous equations below.
Find the values for x and y for the simultaneous equations below.
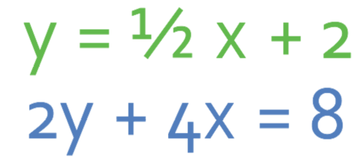
The first equation is already in the form y = mx + c, but the second equation is not. We turn the second equation into this form by making y the subject.
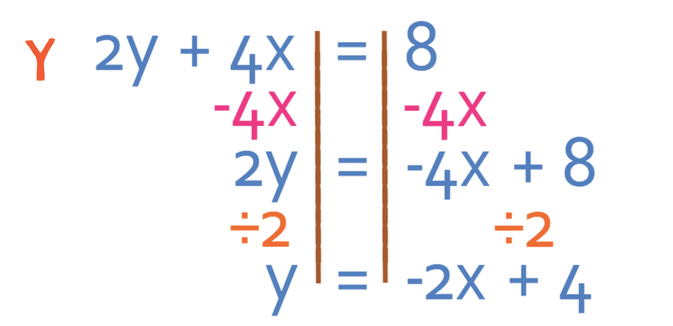
We now have our two equations:
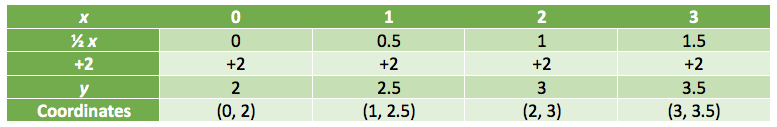
Both of the equations are now in the y = mx + c form making them easy to plot. The two equations and the tables are:
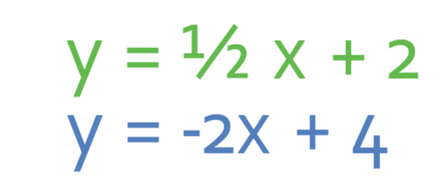
y = ½ x + 2
y = ½ x + 2
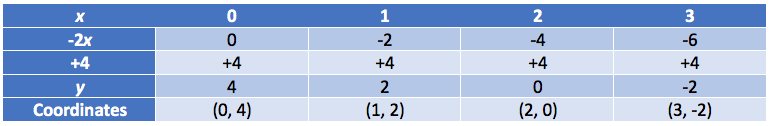
y = -2x + 4
We can now plot these two lines onto a graph and find the coordinates of the point/ points where the lines intersect one another.

The green line is the graph y = ½ x + 2. The blue line is the graph 2y + 4x = 8 (or y = -2x + 4)
These two graphs intercept at the coordinates (0.8, 2.4). Therefore, x is 0.8 and y is 2.4.