B1: Quiz 10 – Answers
2) Osmosis is the net movement of water molecules through a partially permeable membrane from an area of higher water concentration to an area of lower water concentration
3)
a)
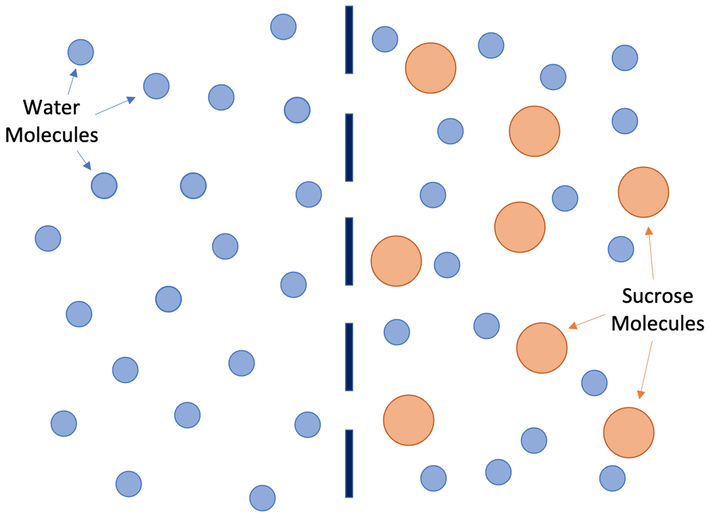
i) Yes – the water molecules can pass through the partially permeable membrane as they are small enough to fit through the holes in the membrane
ii) No – the sucrose molecules cannot pass through the partially permeable membrane as they are too large to fit through the holes in the membrane
b) Left
c) From the left to the right
4) The 3 main factors are:
- temperature
- concentration gradient
- surface area
5)
a)
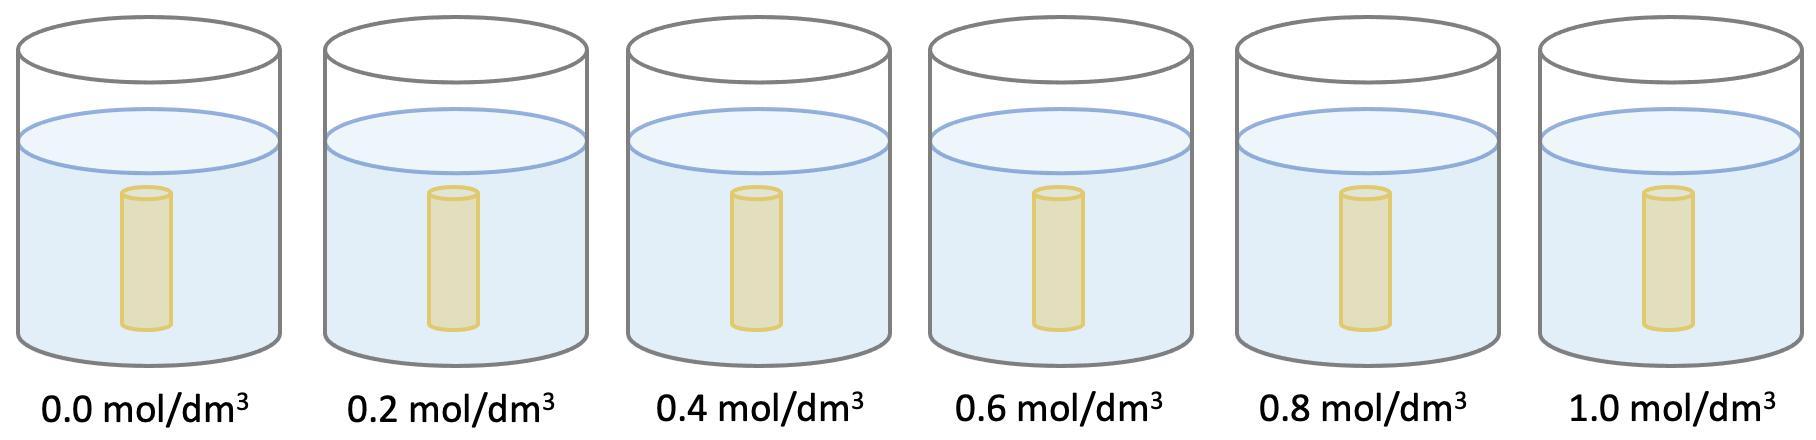
i) The pure water beaker (0.0 mol/dm3) has the highest water concentration
ii) The net movement of water will be into the potato cylinder, which will result in the mass of the potato cylinder increasing
b)
i) The 1.0 mol/dm3 beaker has the lowest water concentration
ii) The net movement of water will be out of the potato cylinder, which will result in the mass of the potato cylinder decreasing
c) The student should use the same potato so that all of the potato cylinders have the same water concentration/ concentration of solutes
d)
i) The masses of the potato cylinders will be different, thus meaning that it is best to work out percentage change in mass rather than actual change in mass
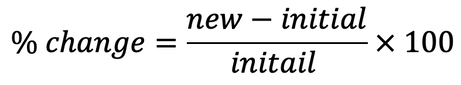
ii) Allow any words that mean the same as “new” or “initial”
iv) -6.9 %
e)
i)
1) What is a partially permeable membrane?
2) Define osmosis.
3) We have the diagram below. The dark blue dashed line is a partially permeable membrane.
a)
i) Are the water molecules able to pass through the partially permeable membrane? Explain your answer.
ii) Are the sucrose molecules able to pass through the partially permeable membrane? Explain your answer.
b) Which side has the higher water concentration; the left or the right?
c) Will the net movement of water molecules be from left to right or from right to left?
4) Give the three main factors that affect the rate of osmosis.
5) A student undertakes an experiment to investigate how different salt solutions effects the movement of water molecules into and out of potato cylinders. She uses 6 different salt solutions ranging from a concentration of 0.0 mol/dm3 to 1.0 mol/dm3; the 6 different beakers with the concentrations that she uses are shown below.
She creates the potato cylinders using an apple corer. She then finds the mass of each potato cylinder before placing them into one of the salt solutions. The cylinders are left in the salt solutions for 8 hours. After 8 hours, she dries the potato cylinders off and measures the masses of them again.
a)
i) Out of the 6 beakers of salt solution, which beaker has the highest water concentration?
ii) For the beaker that you answered for part ai, would the net movement of water be into the potato cylinder or out of the potato cylinder? What effect would this have on the mass of the potato cylinder?
b)
i) Out of the 6 beakers of salt solution, which beaker has the lowest water concentration?
ii) For the beaker that you answered for part bi, would the net movement of water be into the potato cylinder or out of the potato cylinder? What effect would this have on the mass of the potato cylinder?
c) When undertaking this experiment, why should the student use the same potato?
d)
i) Why is it best to work out the percentage change in mass of the potato cylinders rather than the actual change in mass?
ii) What is the equation for percentage change?
iii) The mass of a potato cylinder before it went into the beaker with a concentration of 0.2 mol/dm3 was 7.29 grams. The mass of this potato cylinder after it has been in the 0.2 mol/dm3 beaker for 8 hours is 7.61 grams. Calculate the percentage change in mass. Give your answer to one decimal place.
iv) The mass of a potato cylinder before it went into the beaker with a concentration of 1.0 mol/dm3 was 7.34 grams. The mass of this potato cylinder after it has been in the 1.0 mol/ dm3 beaker for 8 hours is 6.83 grams. Calculate the percentage change in mass. Give your answer to one decimal place.
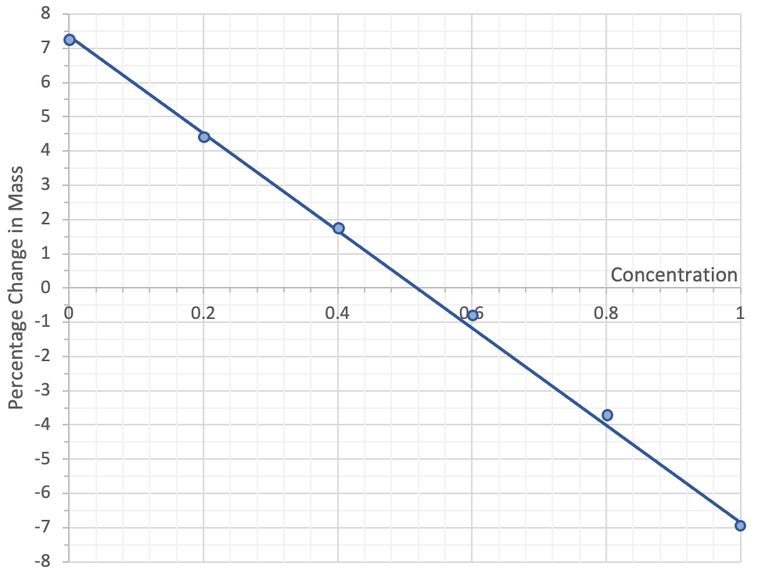
e) The table below shows the values for the percentage change in mass for the potato cylinders in the 6 different beakers. There are gaps in the table for the beakers with a concentration of 0.2 mol/dm3 and 1.0 mol/dm3 as these were worked out in part d.
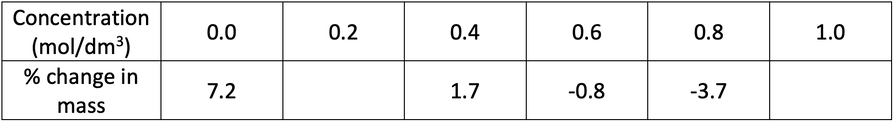
i) Plot the values from the above table on the graph below and add a curve/ line of best fit.
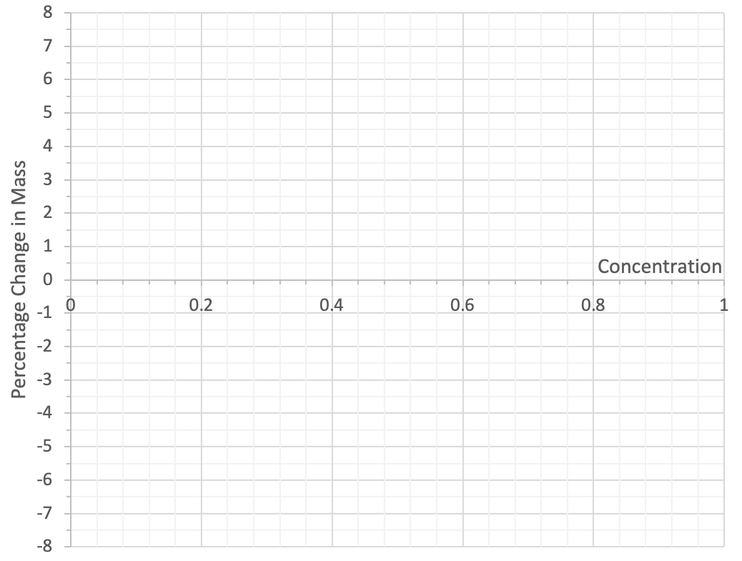
ii) Estimate the concentration inside the potato cylinders.