Back to B4 Home
B4 C) Photosynthesis – Multiple Factors
B4 C) Photosynthesis – Multiple Factors
Sometimes it will be the case that we have a graph that will have a few curves on that will show more than one limiting factor.
Example 1
The graph below shows how the rate of photosynthesis is affected by temperature and light intensity. One of the curves is drawn for a temperature of 10°C and the other curve is drawn for a temperature of 25°C.
The graph below shows how the rate of photosynthesis is affected by temperature and light intensity. One of the curves is drawn for a temperature of 10°C and the other curve is drawn for a temperature of 25°C.
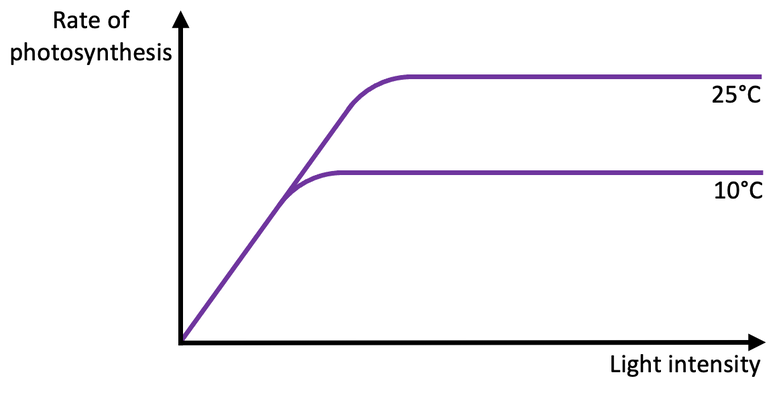
At the start of the graph for both the 10°C and 25°C curve, light intensity is the limiting factor. We know that light intensity is the limiting factor because as we increase light intensity, the rate of photosynthesis increases.
When the curves go flat, it is showing us that the rate of photosynthesis stays the same and light intensity is no longer the limiting factor. The curve for 25°C levels off at a higher rate of photosynthesis than the curve for 10°C. This tells us that temperature must be the limiting factor when the 10°C curve goes flat.
When the curves go flat, it is showing us that the rate of photosynthesis stays the same and light intensity is no longer the limiting factor. The curve for 25°C levels off at a higher rate of photosynthesis than the curve for 10°C. This tells us that temperature must be the limiting factor when the 10°C curve goes flat.
Example 2
The graph below shows how the rate of photosynthesis is affected by a few factors. One of the curves is for a concentration of carbon dioxide of 0.04% and a temperature of 30°C, and the other curve is for a concentration of carbon dioxide of 0.1% and a temperature of 30°C.
The graph below shows how the rate of photosynthesis is affected by a few factors. One of the curves is for a concentration of carbon dioxide of 0.04% and a temperature of 30°C, and the other curve is for a concentration of carbon dioxide of 0.1% and a temperature of 30°C.
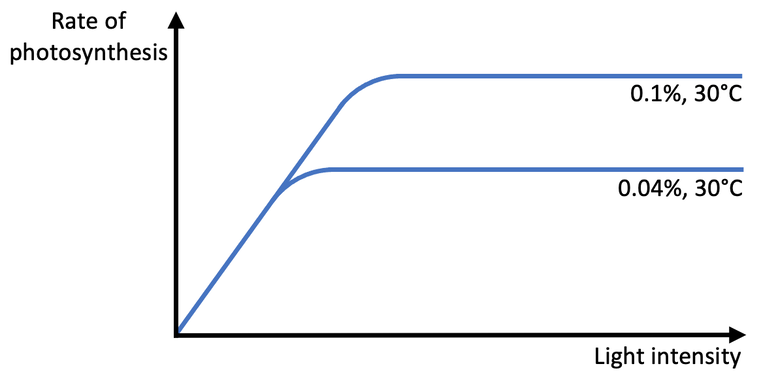
At the start of the graph, light intensity is the limiting factor for both of the curves.
When the curves go flat, it tells us that the rate of photosynthesis remains the same and light intensity is no longer the limiting factor. This happens at a higher rate of photosynthesis for the concentration of carbon dioxide being 0.1% compared with a concentration of carbon dioxide being 0.04%. This means that the limiting factor when the curve for the concentration of carbon dioxide of 0.04% goes flat is the concentration of carbon dioxide. We know that carbon dioxide is the limiting factor because the temperature is the same for both curves (the temperature for both curves is 30°C).
When the curves go flat, it tells us that the rate of photosynthesis remains the same and light intensity is no longer the limiting factor. This happens at a higher rate of photosynthesis for the concentration of carbon dioxide being 0.1% compared with a concentration of carbon dioxide being 0.04%. This means that the limiting factor when the curve for the concentration of carbon dioxide of 0.04% goes flat is the concentration of carbon dioxide. We know that carbon dioxide is the limiting factor because the temperature is the same for both curves (the temperature for both curves is 30°C).