B4 D) Investigating Photosynthesis
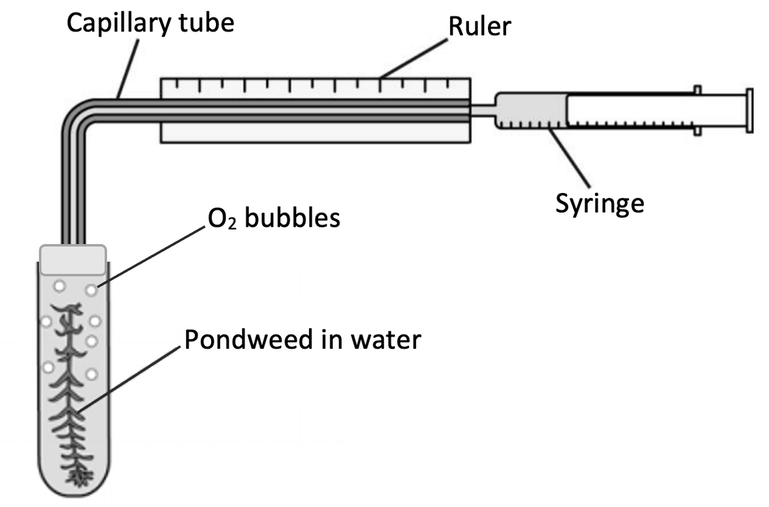
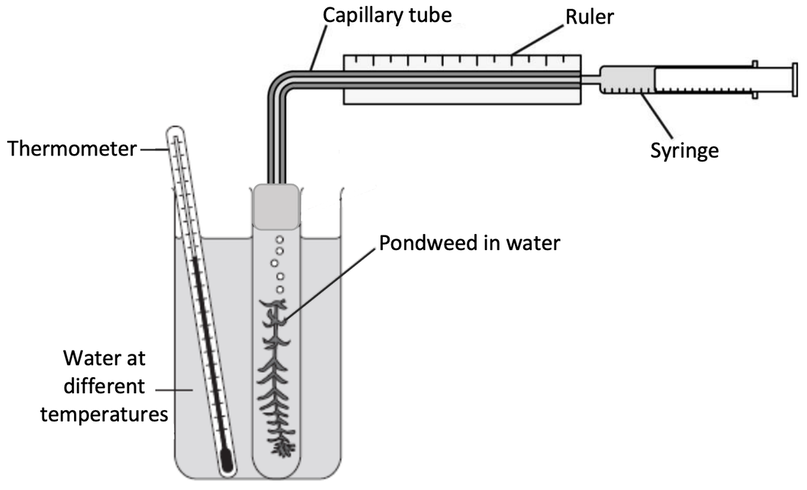
The experiment that we will use to measure the rate of photosynthesis is shown below.
We will complete the experiment and change the factor that we are investigating (either light intensity, concentration of carbon dioxide or temperature). We would need to make sure that we only change the factor that we are investigating, and we keep all of the other factors constant. This is so that the changes in the volume of oxygen produced is solely down to the factor that we changed and not any other factors that we didn’t control/ keep the same. We then complete the experiment twice at each of the different conditions and find the mean of the results.
Sometimes in the exam you may be asked why you should use an experiment like this with capillary tubing, a ruler and a syringe to measure the rate of photosynthesis rather than counting the oxygen bubbles produced by the pondweed. The reason why you would use this experiment is because it will calculate the volume of oxygen produced more accurately. If you were counting bubbles, you may miss bubbles, the bubbles would be of different sizes etc. This will mean that counting bubbles is not an accurate way of measuring the volume of gas produced and therefore is not an accurate way to find the rate of photosynthesis.
I am now going to go through how we can modify this experiment to investigate the effect that light intensity, concentration of carbon dioxide and temperature have on the rate of photosynthesis.
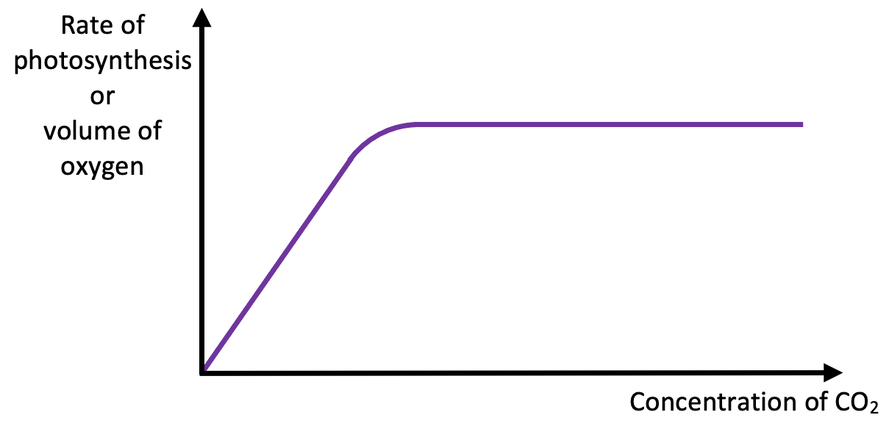
Concentration of CO2
We then complete the experiment a few times with different amounts of sodium hydrogencarbonate dissolved in the water and measure the volume of oxygen produced. From our values, we can plot a graph with concentration of carbon dioxide/ amount of sodium hydrogencarbonate dissolved on the x axis, and the rate of photosynthesis/ volume of oxygen produced on the y axis. My graph is shown below.
We can modify this experiment to investigate the effect that temperature has on the rate of photosynthesis by placing the test tube with pondweed into a water bath. We then set the temperature of the water bath at a variety of different temperatures starting from a low temperature and measure the volume of oxygen produced. We start from a low temperature and end with a high temperature because if we go from a high temperature to a low temperature, we would denature the enzymes, which would mean that the enzymes would be unable to function at any temperature. If we didn’t have a water bath, we can place the test tube with pondweed into a beaker like what is shown below; we can add heat to the beaker by placing it on top of a Bunsen burner.
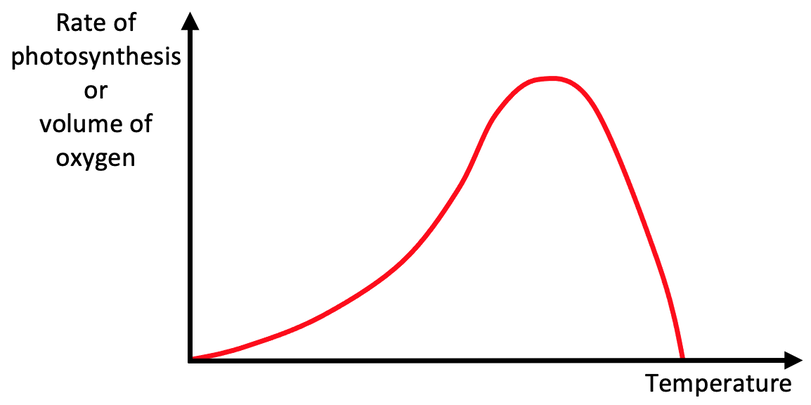
However, as the temperature increases too much, the rate of photosynthesis decreases. This is because the enzymes start to denature. Denaturing is where the excessive temperature causes the bonds that make up the enzyme to break. This causes the active site of the enzymes to change shape, which means that the reactants can no longer fit into the active site of the enzymes, thus resulting in the rate of photosynthesis decreasing. The denaturing temperature depends on the plant but it is usually around 35-45°C.
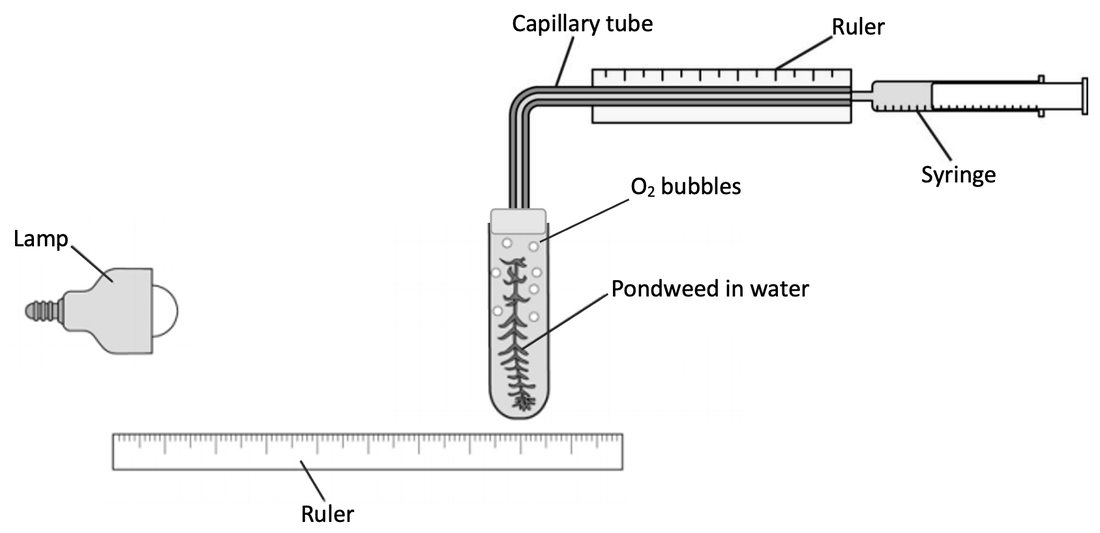
We can investigate the effect that light intensity has on the rate of photosynthesis by having a lamp at different distances away from the test tube with the pondweed in. The light from the lamp needs to be a white light and a light that doesn’t get hot. The light should not get hot because temperature affects the rate of photosynthesis and if we had a hot light and moved it closer to the test tube, it would cause both light intensity and temperature to increase. If this was the case, we would be unable to say for sure whether the change in the rate of photosynthesis was down to light intensity changing or temperature changing. Therefore, we need to use a light that does not get hot. We set the apparatus up like what is shown below.
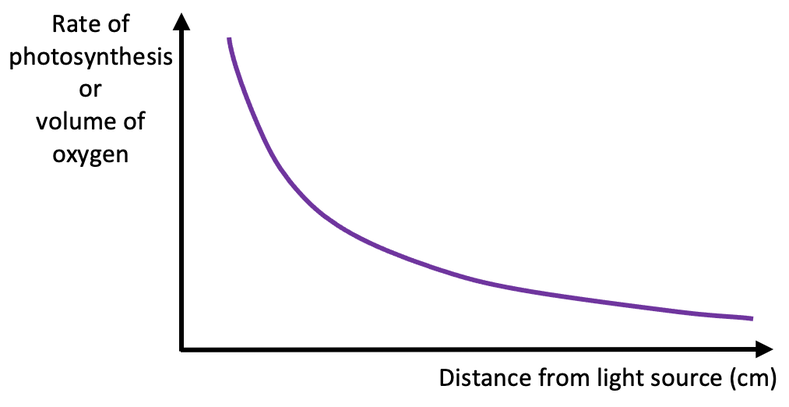
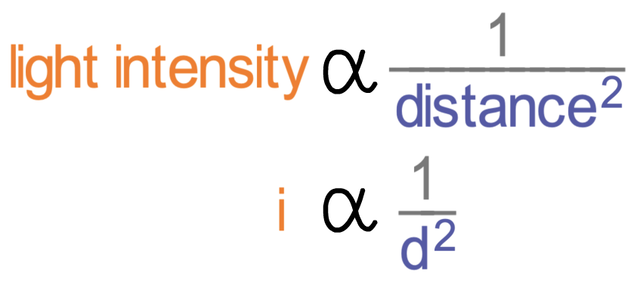
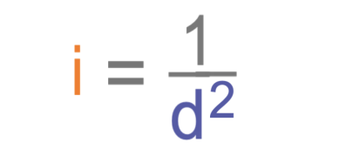
Inverse proportion means that the variables move in opposite directions; if one variable increases, the other variable decreases (and vice versa)
If we were to halve the distance of the lamp away from the pondweed (distance decreases), the light intensity would increase by 4 times (22 = 4). If we were to make the distance of the lamp away from the pondweed a third of what it was, the light intensity would be 9 times greater (32 = 9).
On the contrary, if we were to move the lamp twice as far away from the pondweed (distance increases), the light intensity would be 4 times less. Also, if we were to triple the distance of the lamp away from the pondweed, the light intensity would be 9 times less.
It may be the case that we are asked to work out the light intensity in arbitrary units for a particular distance. We do this by subbing the value for the distance into the above formula.
Example 1
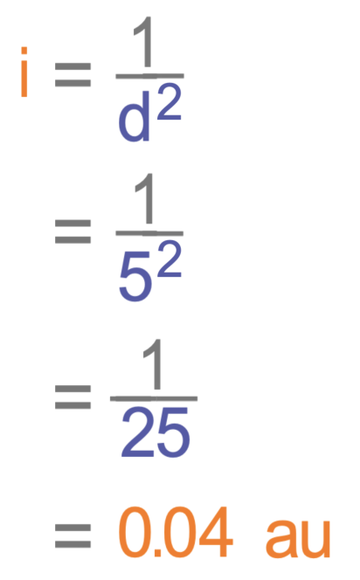
Find the light intensity in arbitrary units when the distance is 5 cm.