B7 F) The Distribution of Organisms – Quadrats
We can investigate the distribution of organisms in two different ways.
- The first way is to use quadrats to compare how common an organism is in two different locations.
- The second way is to use quadrats along a transect to measure how the distribution of organisms varies across an area.
We will be looking at the first way in this section and the second way in the next section.
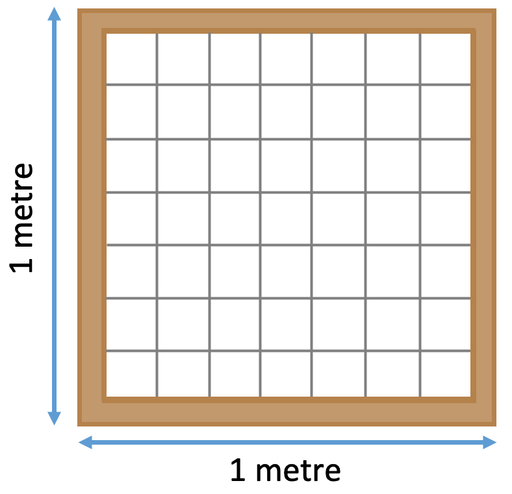
A quadrat is a square with a known area; quadrats are usually 1 m2, but they can vary in size. Quadrats are sometimes split into smaller areas within the larger area, such as 10 cm x 10 cm squares. An example of a quadrat is shown below.
We are now going to look at how we can compare the distribution of an organism between two different locations. We are going to compare the populations of daisies between the middle of a field and under a tree.
We use quadrats by randomly placing them on the ground in the location that we are investigating. We need to place the quadrats randomly so that the data that we collect is representative of the location that we are assessing. We then count the number of the organism or organisms that we are investigating in the quadrat; for our example, we are interested in daisies, so we count the number of daisies in the quadrat. We place the quadrat in a few different places within each of the locations and find the mean; we find the mean in the usual way – we divide the total number of organisms by the number of quadrats. The formula for this is shown below.

Let’s have an example of working out the mean.
Question
I place a quadrat down 6 times in the middle of a field. The number of daises in each of the quadrats is 11, 15, 8, 14, 15 and 9. Find the mean number of daisies per quadrat.
We find the mean number of daisies per quadrat by dividing the total number of daises by the number of quadrats (6). The working is shown below.

Therefore, the mean number of daisies per quadrat in the middle of a field is 12 daisies.
Making Comparisons
Let’s now suppose that we did the same to find the mean number of daisies per quadrat under a tree and found the mean to be 1.7 daisies. A question may then ask you to compare the distribution of daisies between the middle of a field and under a tree; we are going to do this now.
The two values that we have are 12 daisies per quadrat in the middle of a field and 1.7 daisies per quadrat under a tree. From these two values, we can say that there are more daisies in the middle of a field compared to under a tree; another way of saying this is that the daisies are more abundant in the middle of a field compared to under a tree. This is what we would expect because the daisies in the middle of a field will have greater access to resources compared to the daisies under a tree (these resources include light and water).
We can also use quadrats to estimate the population of an organism in an area. The process used is best explained through a question.
Question
A student wants to find an estimate for the number of daisies in a school field that is 500 m2. They randomly throw a 1 m2 quadrat down 4 times and count the number of daisies in each of the 4 quadrats; the number of daisies were 9, 6, 8 and 11. Estimate the population of daisies in the whole school field.
The first step in answering this question is to work out the mean number of daisies per quadrat. We do this in the same way that we did in the previous question; we divide the total number of daises by the number of quadrats (4).

This tells us that the mean number of daisies per quadrat is 8.5. The area of the quadrat was 1 m2, which means that the mean number of daisies per 1 m2 is 8.5.
The field is 500 m2, which is 500 times greater than the 1 m2 quadrat. Therefore, we find an estimate for the number of daisies in the 500 m2 field by multiplying the mean number of daisies per 1 m2 (8.5) by the number of times that the field is greater than the quadrat (500).

Therefore, an estimate for the total number of daisies in the whole 500 m2 field is 4,250.
This is an estimate rather than the actual number of daisies in the field. We would usually find an estimate rather than finding the actual number because finding an estimate is considerably quicker and cheaper than finding the actual number; imagine how long it would take us and how hard it would be to find the actual number of daisies in the whole field. We can make our estimates more reliable/ accurate by increasing the number of quadrats that we use to find our average. In this example, we only used 4 quadrats, but our estimate would have been more reliable/ accurate if we would have used more quadrats (such as 10 quadrats).