Back to B7 Home
B7 G) The Distribution of Organisms – Transects
B7 G) The Distribution of Organisms – Transects
We can investigate the distribution of organisms in two different ways.
We looked at the first way in the previous section, and we are going to look at the second way in this section.
- The first way is to use quadrats to compare how common an organism is in two different locations.
- The second way is to use quadrats along a transect to measure how the distribution of organisms varies across an area.
We looked at the first way in the previous section, and we are going to look at the second way in this section.
Using Transects
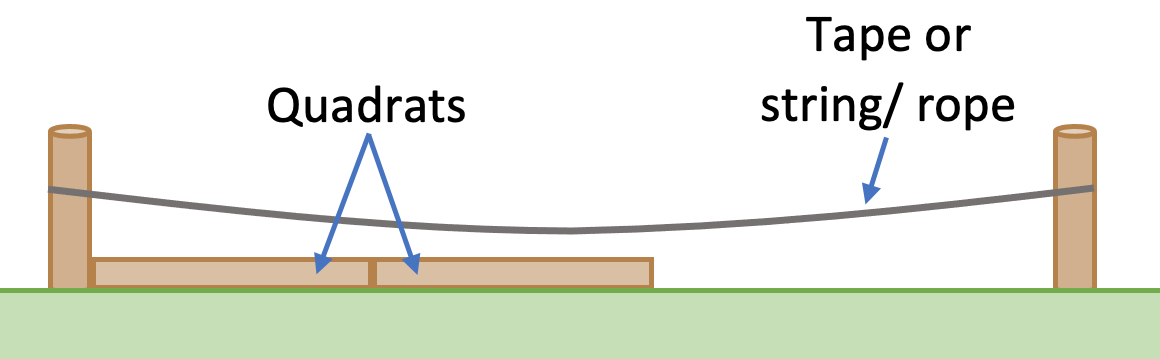
We can investigate the distribution of organisms across an area by using a transect. A transect is essentially a piece of tape or string/ rope that goes across an area. We use a transect to give us a line to investigate the distribution of organisms along. A transect is shown in the diagram below.
We can investigate the distribution of organisms across an area by using a transect. A transect is essentially a piece of tape or string/ rope that goes across an area. We use a transect to give us a line to investigate the distribution of organisms along. A transect is shown in the diagram below.
There are two ways that we can use transects to investigate the distribution of organisms across an area.
Using a transect with quadrats (way 2) will give us more information compared with just using a transect (way 1).
- One way is to count the number of each type of organism that are touching the transect (either the tape or the string/ rope).
- The second way is to use quadrats. We place the quadrats either next to each other or at regular intervals along one side of the transect. We then count the number of each type of organism in each of the quadrats.
Using a transect with quadrats (way 2) will give us more information compared with just using a transect (way 1).
Percentage Coverage
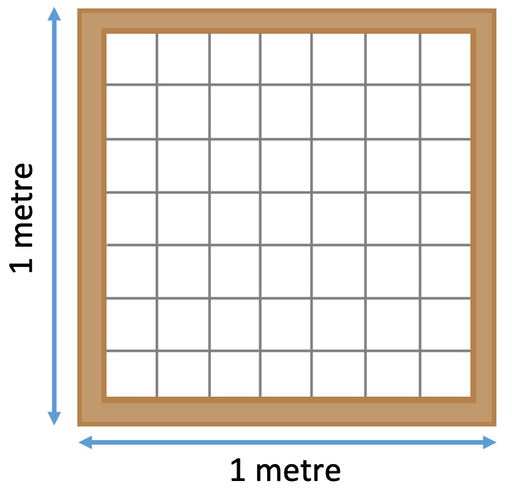
We can use quadrats to work out the percentage coverage of organisms in an area. Percentage coverages is very useful if we are looking at an organism where there are loads of them and they cover a large area; for example, it will be more useful to calculate the percentage coverage for grass or a particular type of weed compared to calculating the exact number of these organisms. Most quadrats are 1 m2 and are split up into smaller squares that are 10 cm by 10 cm.
The first step in finding percentage coverage is to place the quadrat down randomly. We then use the smaller squares to draw a sketch of what we see; we shade the areas where the organisms that we are interested in are (if we are looking at more than one organism, we should shade in different colours and add a key to our sketch). After we have our sketch, we then count the number of smaller squares in the quadrat that are covered by the organism that we are interested in. We then use this information to calculate the percentage coverage for that organism.

Let’s have an example.
Question
I place a quadrat randomly in a field to investigate the percentage coverage of two organisms; plant A and plant B. My sketch is shown below.
Question
I place a quadrat randomly in a field to investigate the percentage coverage of two organisms; plant A and plant B. My sketch is shown below.
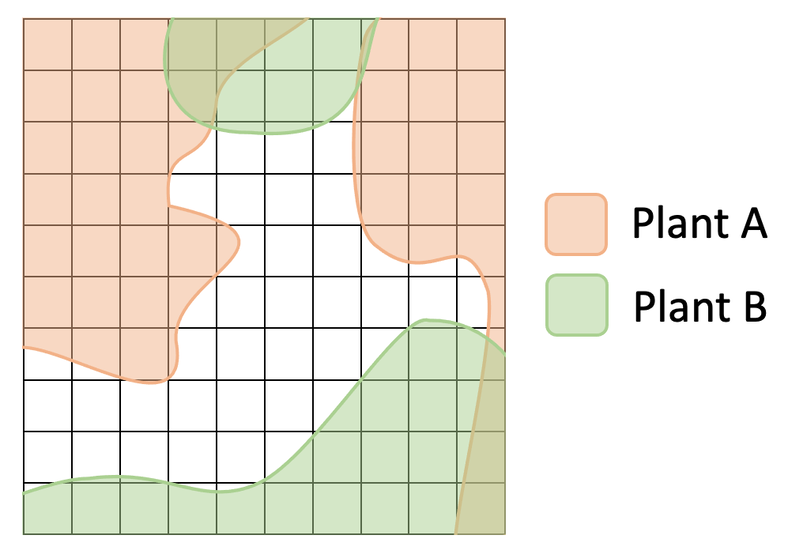
From the above sketch, calculate the percentage coverage for plant A and plant B. Also, compare the percentage coverage.
We calculate the percentage coverage for the organisms by using the percentage coverage formula (the formula shown above). Let’s find the percentage coverage for plant A first.
Plant A
In order to find the percentage coverage, we need to find how many smaller squares are covered by plant A. When we do this, we see that plant A covers 45 squares. There are 100 squares in total (10 x 10 = 100). We now have everything that we need to calculate the percentage coverage for plant A.

The percentage coverage for plant A is 45% (there will usually be a range of acceptable answers for these types of questions, so do not worry too much if you get a slightly different answer).
Plant B
We now do the same for plant B. From the sketch, we see that plant B covers 29 squares. The total number of squares in the quadrat is still 100. We sub these values into the formula.
Plant B
We now do the same for plant B. From the sketch, we see that plant B covers 29 squares. The total number of squares in the quadrat is still 100. We sub these values into the formula.
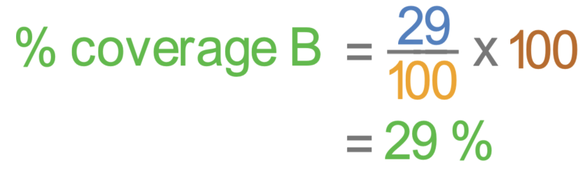
The percentage coverage for plant B is 29%.
Compare
When we compare the percentage coverage values, we see that the percentage coverage for plant A (45%) is greater than the percentage coverage for plant B (29%). This means that plant A is more abundant than plant B.
Compare
When we compare the percentage coverage values, we see that the percentage coverage for plant A (45%) is greater than the percentage coverage for plant B (29%). This means that plant A is more abundant than plant B.