Back to C6 Home
C6 B) Rate of Reaction
C6 B) Rate of Reaction
The rate of reaction measures how fast reactions happen. One reason why it is useful to understand how fast reactions happen is so that we can find the optimal conditions for producing certain substances. This is especially true for reversible reactions because the conditions that the reversible reactions take place in determines the position of the dynamic equilibrium (reversible reactions are where reactions can go in both directions; the reactants can react to become the products, and the products can react to become the reactants). Changing the temperature, pressure and concentration will move the position of the dynamic equilibrium in different directions (there is more information on reversible reactions and dynamic equilibriums in the later sections in this whole section)
We can measure the rate of reaction by using either of the following formulas:
We can measure the rate of reaction by using either of the following formulas:
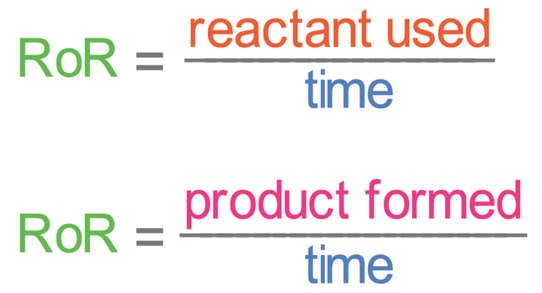
It is usually easier to measure the amount of a product formed rather than the amount of a reactant used up, but it does depend on the reaction.
We can undertake experiments to find what the rate of reaction is. We can then plot the results to obtain a rate of reaction graph. Let’s first look at a few different experiments that we can use to find out what the rate of reaction is.
We can undertake experiments to find what the rate of reaction is. We can then plot the results to obtain a rate of reaction graph. Let’s first look at a few different experiments that we can use to find out what the rate of reaction is.
A Gas is Produced
There are two ways that we can measure the rate of reaction when a gas is produced.
Method 1 – Change in Mass
One method is to measure the change in mass. The set up for measuring the change in mass is shown below.
There are two ways that we can measure the rate of reaction when a gas is produced.
Method 1 – Change in Mass
One method is to measure the change in mass. The set up for measuring the change in mass is shown below.
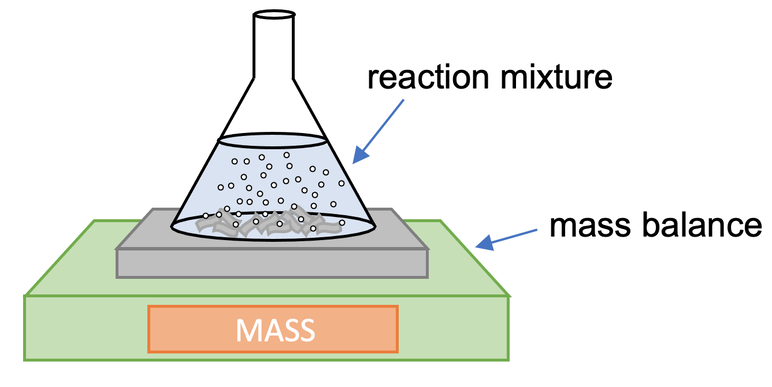
We place our conical flask that contains the reactants on a mass balance. We then monitor how the mass changes over time; we would take readings from the mass balance every 15 seconds (or at some other regular interval). The gas that is produced by the reaction will bubble up to the surface and escape into the air in the room. This results in the mass of the conical flask decreasing over time.
A faster decrease in mass means that there is a greater rate of reaction. A slower decrease in mass means that there is a lower rate of reaction. A safety precaution for this experiment is to do with the fact that the gas that is produced by this reaction is released into the room. This is fine if the gas is harmless, but if the gas is harmful, the experiment must take place under a fume cupboard (the fume cupboard will take the harmful gases away, thus meaning that no harmful gases enter the room).
We can plot a rate of reaction graph from the data that we collect. We plot the mass lost against time; time will be on the x axis and mass lost will be on the y axis.
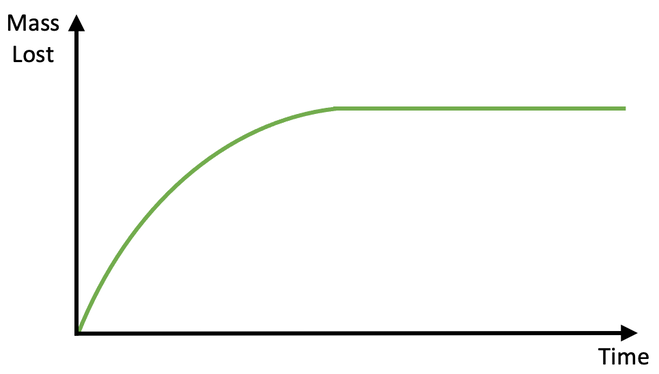
There are two different parts on the above graph; the curved part at the start and the flat part at the end.
At the start of the experiment, reactions are taking place and gas is being produced. This results in mass being lost, which is why the line is curved.
After a certain period of time, one of the reactants will be used up and the reactions will stop. When the reactions stop, no more gas is being produced, thus meaning that no more mass is being lost. This is the flat part of the curve.
So, reactions are taking place during the curved part, and reactions are not taking place on the flat part. The steeper the curve is, the greater the rate of reaction is; the curve is the steepest right at the start, so the rate of reaction is the fastest right at the start. Throughout the reaction, the curve becomes flatter (less gas is produced in a given time), which tells us that the rate of reaction falls. Eventually the curve become horizontal, which tells us that the reactions have stopped.
Method 2 – Volume of Gas Produced
The second experiment that we can use to measure the rate of reaction when a gas is produced is to use a gas syringe. The apparatus will be set up like the diagram below.
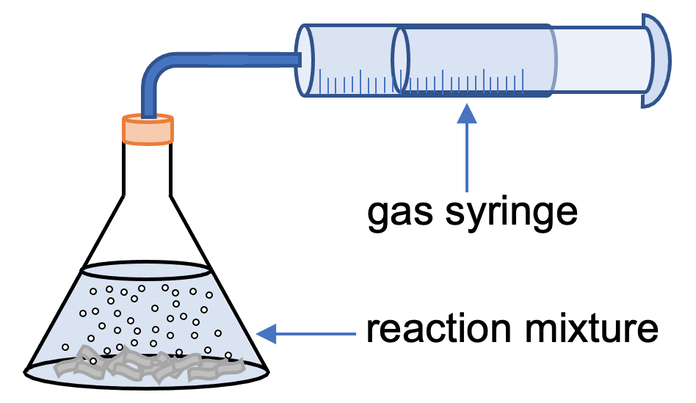
The gas that is given off from the reaction will cause the gas syringe to move. We then monitor how the volume of gas changes over time; we would take readings for the volume of gas every 15 seconds (in a similar way to the previous experiment).
A greater rate of reaction will produce more gas and therefore cause the gas syringe to move quicker. So, a faster moving gas syringe means a greater rate of reaction, and a slower moving gas syringe means a slower rate of reaction.
When we are setting up the experiment, we need to choose an appropriate syringe. This is because if too much gas is produced too quickly, the end of the syringe may fire out, which could be rather dangerous.
We can plot a rate of reaction graph from the data that we collect. We plot the volume of gas produced against time; time will be on the x axis and volume of gas produced will be on the y axis.
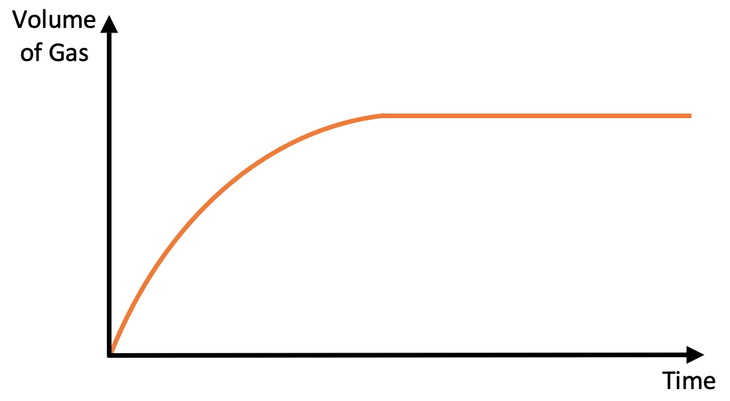
Reactions are taking place during the curved part of the graph and reactions are not taking place on the flat part of the graph (the reactions stop when the graph becomes horizontal/ flat). The steeper the curve is, the greater the rate of reaction is; the rate of reaction is the fastest at the start and then it slows down overtime until it stops.
Precipitation
Another way that we can measure the rate of reaction is to use a precipitation experiment. We can only use this experiment when we have two transparent solutions that react together to form a precipitate (the precipitate will make the solution cloudy). We set up the experiment like what is shown below.
Another way that we can measure the rate of reaction is to use a precipitation experiment. We can only use this experiment when we have two transparent solutions that react together to form a precipitate (the precipitate will make the solution cloudy). We set up the experiment like what is shown below.
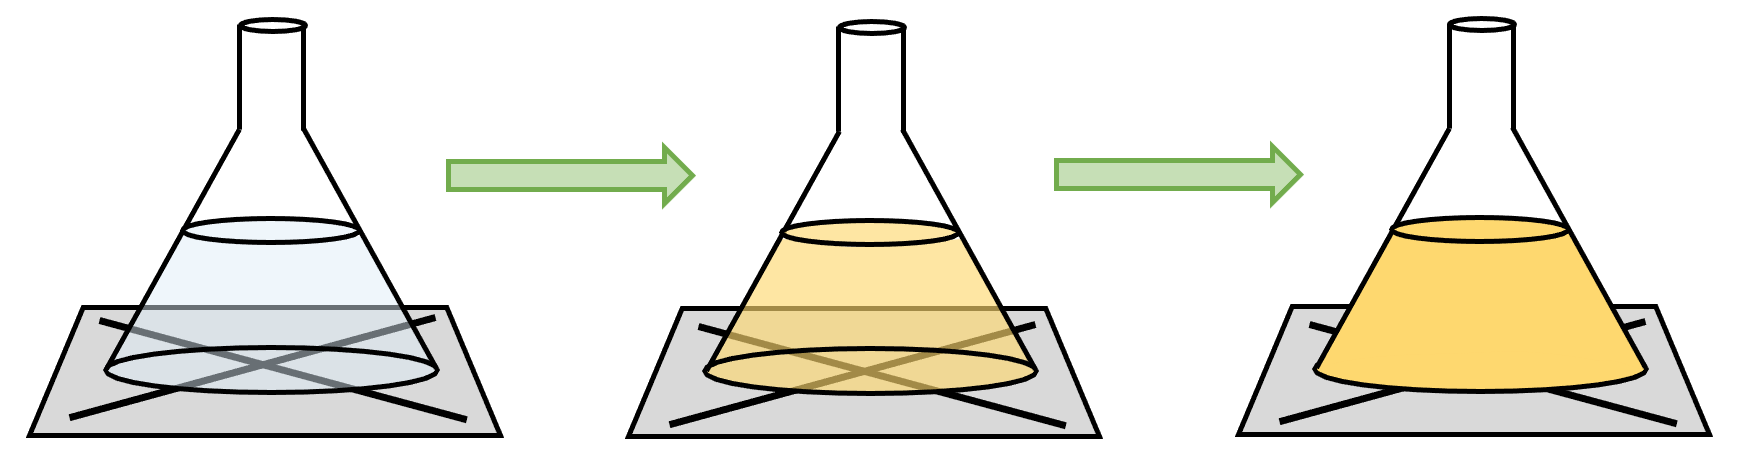
To undertake this experiment, we place a bit of paper with a drawn cross (X) on underneath the conical flask where the reaction will take place. We then pour the two solutions into the conical flask. The solutions will start reacting, which produces a precipitate resulting in the solution becoming cloudy. Throughout the reaction, we look down the top of the conical flask at the cross that we drew, and time how long it takes for us to be unable to see the cross under the conical flask.
The shorter the time taken for us to be unable to see the cross, the greater the rate of reaction. The longer the time taken for us to be unable to see the cross, the lower the rate of reaction.
This method is fairly arbitrary because it is hard to have a consensus between people for when the cross disappears. Some individuals will say that they can still see the cross and other individuals will say that the cross has disappeared. This issue can be overcome by using the same individual to look down the conical flask and say when the cross has disappeared (this is for when you are undertaking a few experiments to see what effect a factor like temperature has on the rate of reaction).
We are unable to plot a rate of reaction graph for this reaction because we only take one reading (the time when the cross has disappeared) and not multiple readings like the other experiments.