Back to P5 Home
P5 L) Distance Time Graphs – Part 1
P5 L) Distance Time Graphs – Part 1
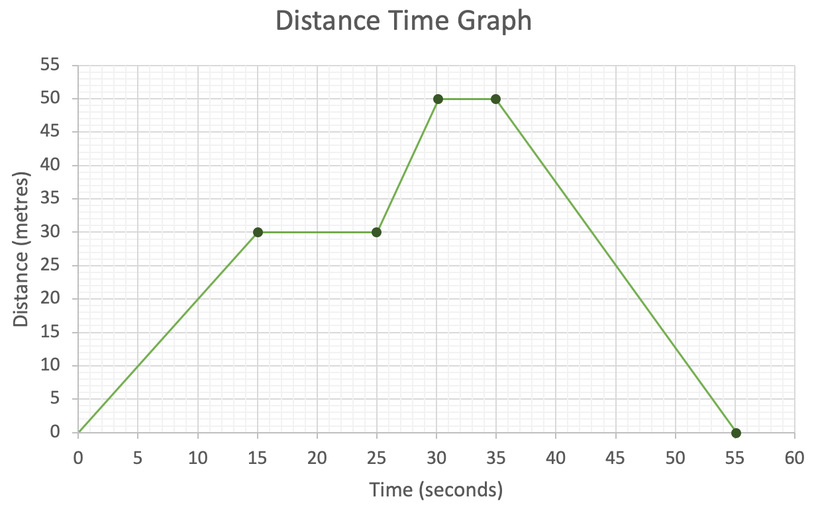
A distance-time graph plots the distance travelled from a starting point (y-axis) against time (x-axis). An example of a distance time graph is given below.
Here are the key points from a distance time graph:
- The gradient is the speed. The steeper the line the faster the object is travelling. The flatter the line, the slower the object is travelling.
- When the line is completely flat, the object is stationary.
- An upwards sloping line (positive gradient) means that the object is travelling away from a starting point. A downwards sloping line (negative gradient) means that the object is travelling back towards the starting point.
- A straight line means that the object is travelling at a constant speed. This is the case when the line is upwards or downwards sloping, or completely horizontal.
- A line that isn’t straight means that the speed of the object is changing; the object is either accelerating or decelerating. If the curve is become steeper, the object is accelerating. If the curve is becoming flatter, the object is decelerating.
- When the line meets the x-axis again, the object has returned to where it started.
Different parts of a Distance-Time Graph
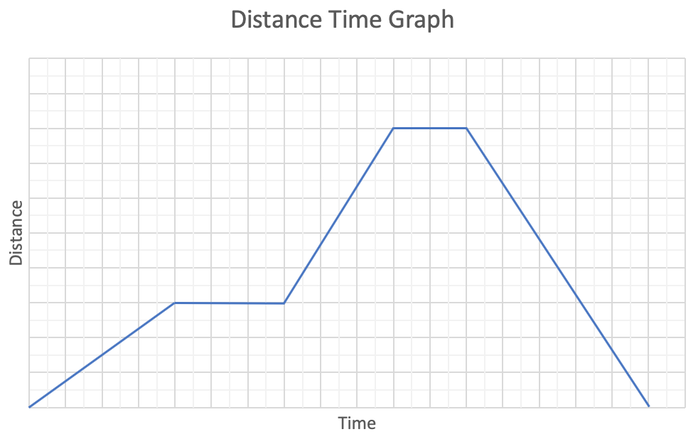
We are now going to work through the different sections of the distance time graph below (this graph is the same as the graph at the start of this section).
We are now going to work through the different sections of the distance time graph below (this graph is the same as the graph at the start of this section).
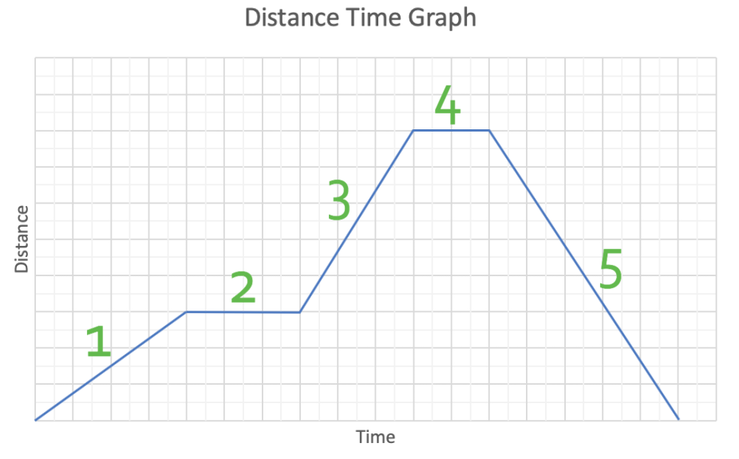
When a distance time graph has a positive gradient, it means that the object is travelling away from where it started from. Therefore, the object is travelling away from where is started from in parts 1 and 3. Part 3 is steeper than part 1, which means that the object is travelling faster during part 3 than part 1.
A flat part of a distance time graph means that the object is not moving. Therefore, the object is stationary during parts 2 and 4.
A negative gradient means that the object is travelling back to where it started from. The gradient of part 5 is negative, which means that the object is travelling back to the start.
The line for all of the parts where the object is moving (part 1, 3 and 5) is completely straight. This means that the object is travelling at a constant speed during each of these parts.
Accelerating and Decelerating
We are now going to talk through the distance time graph below.
We are now going to talk through the distance time graph below.
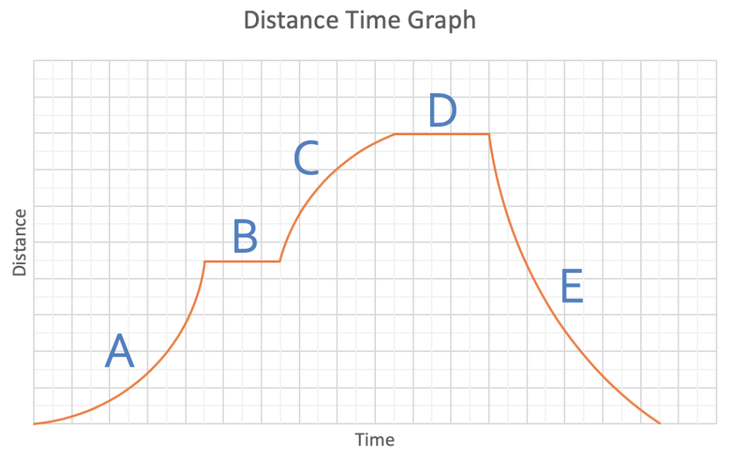
The distance time graph has been split into 5 different sections.
Part A is upwards sloping, which means that the object is travelling away from where it starts. The gradient of the lines becomes steeper during part A, and this means that the object is accelerating; the speed of the object is increasing.
Part B is flat, which means that the object is stationary.
Part C is upwards sloping, which means that the object is travelling away from the starting point. The line in part C starts off quite steep and then it becomes flatter. This means that the object is decelerating; the speed of the object is decreasing.
Part D is flat, and this means that the object is stationary again.
Part E is downwards sloping, which means that the object is travelling back towards the start. The line in part E starts off quite steep and then starts to flatten out. This means that the object is travelling quite fast at the start of part E and then it starts travelling slower as part E continues; the object is decelerating.
Example 1
We are going to be using the following information to draw a distance time graph:
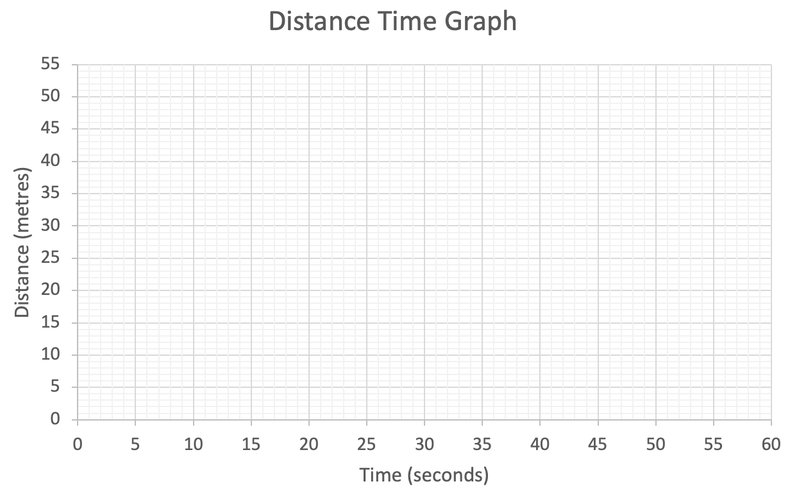
The uncompleted distance time graph is shown below (click here for a printable version of this graph).
We are going to be using the following information to draw a distance time graph:
- Jeremy leaves home at the start and he travels at a constant speed. After 15 seconds he has travelled 30 metres.
- He then has a rest for 10 seconds.
- He then starts walking at a constant speed away from home; he walks for 5 seconds and travels 20 metres.
- Jeremy then has another rest for 5 seconds.
- He then walks at a constant speed back to where he started at the beginning of the journey; it takes Jeremy 20 seconds to get back home.
The uncompleted distance time graph is shown below (click here for a printable version of this graph).
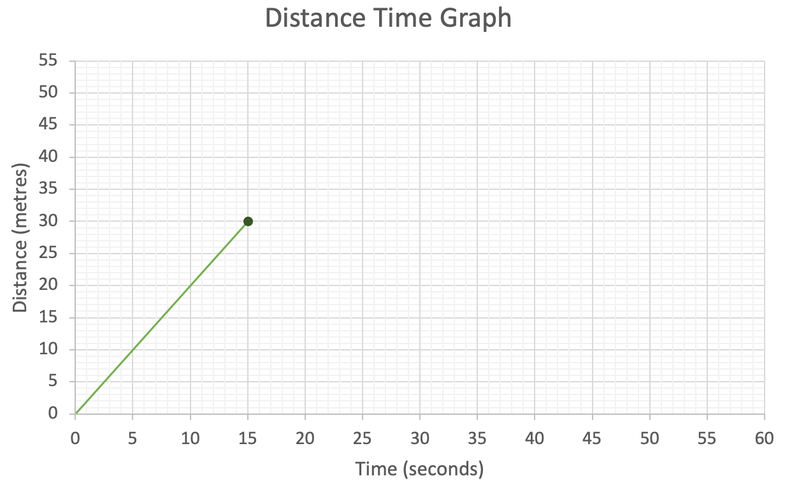
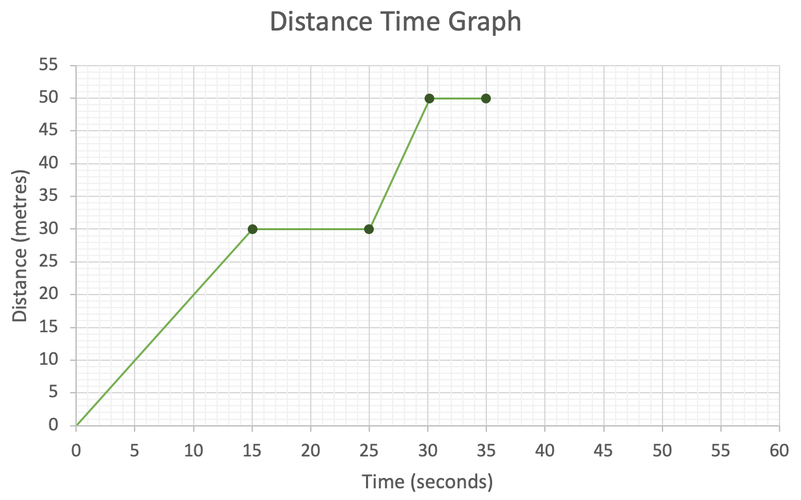
I am going to work with the first piece of information that we are given, which is that Jeremy leaves home, walks at a constant speed and covers 30 metres in 15 seconds. We are able to draw this part of the distance time graph by marking where 15 seconds and 30 metres is. We are told in the question that Jeremy is travelling at a constant speed. This means that the line on the distance time graph will be straight. Therefore, we draw a straight line going from the origin of the graph to the point that we have marked. This is drawn on the graph below.
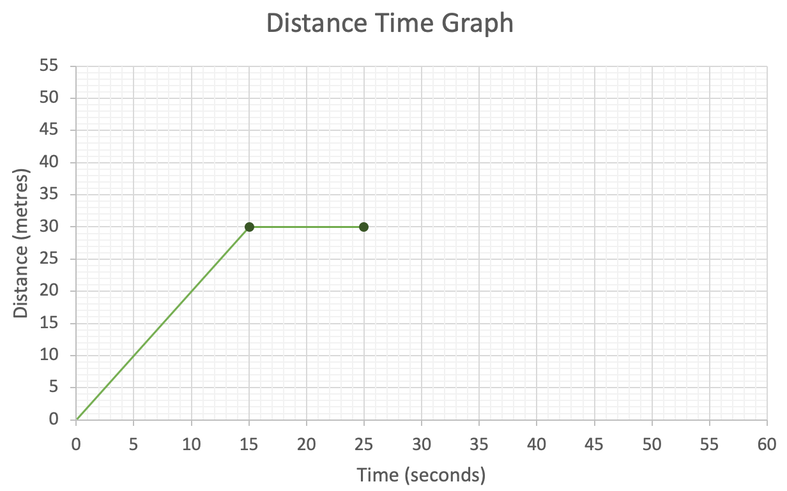
We now move onto the next bullet point, which is that he has a rest for 10 seconds. This means that Jeremy is stationary, and we show this by drawing a flat/horizontal line on the distance time graph. 10 seconds added on to 15 seconds (the end of the previous section) is 25 seconds. We draw a straight horizontal line from the end of the previous line to 25 seconds. This is shown on the graph below.
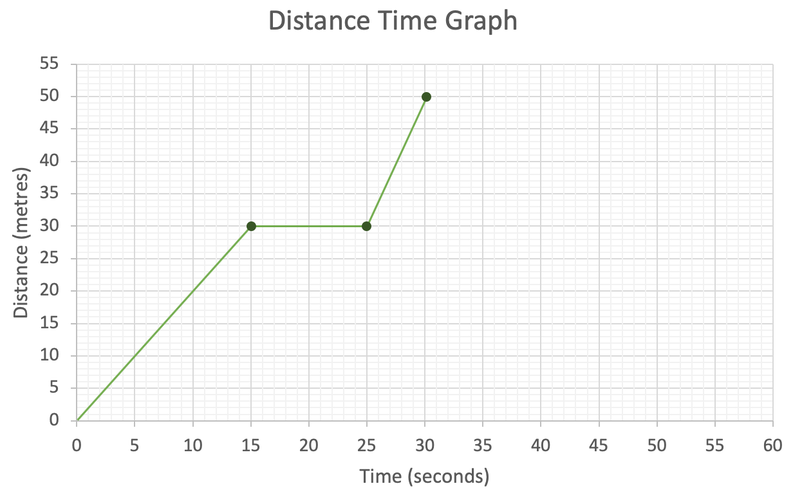
The next bullet point states that Jeremy is walking away, and this means that the line on the distance time graph will be upwards sloping. We are told that Jeremy covers 20 metres in 5 seconds. This means that at the end of this section, the distance will be 50 metres (30 + 20) and the time will be 30 seconds (25 + 5). We can mark this point on to the distance time graph. We are told that Jeremy walks at a constant speed, which means that the line will be straight.
Jeremy then has a rest for 5 seconds and we represent this by using a flat/ horizontal line. The horizontal line goes up until 35 seconds (30 + 5).
The final bullet point states that Jeremy walks at a constant speed back to where he started at the beginning of the journey. This means that the line is going to be downwards sloping and the end of this section will be on the x–axis. We are told that it takes Jeremy 20 seconds, and this means Jeremy will get home at 55 seconds (35 + 20). We can plot 55 seconds and a distance of 0 on the graph. Jeremy travels at a constant speed, which means that the line on the distance time graph will be straight. The completed distance time graph is shown below.