Back to P5 Home
P5 M) Distance Time Graphs – Part 2
P5 M) Distance Time Graphs – Part 2
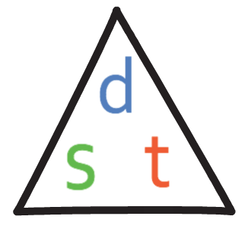
Speed is the distance travelled by something in one unit of time. We are able to work out speed by using the calculation below:

We are able to create the formula triangle below from this information.
There is more information on how to answer questions to do with speed, distance and time in a later section (click here if you would like to know more now).
Example 1
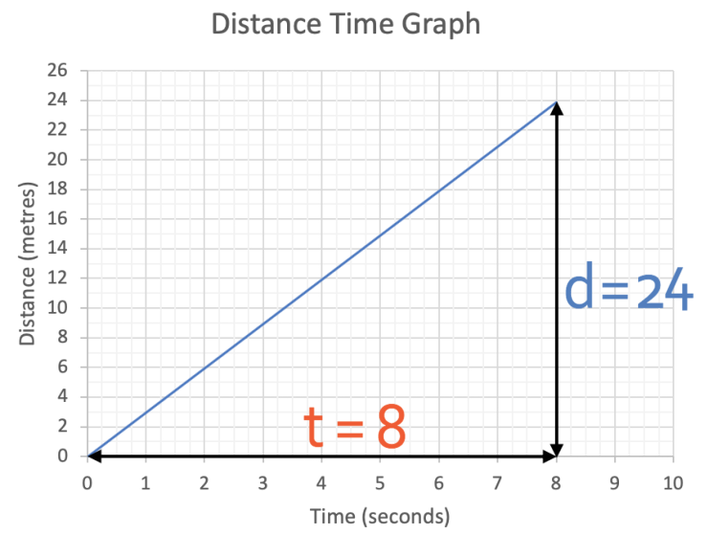
What is the speed for the object that is plotted on the distance time graph below?
What is the speed for the object that is plotted on the distance time graph below?
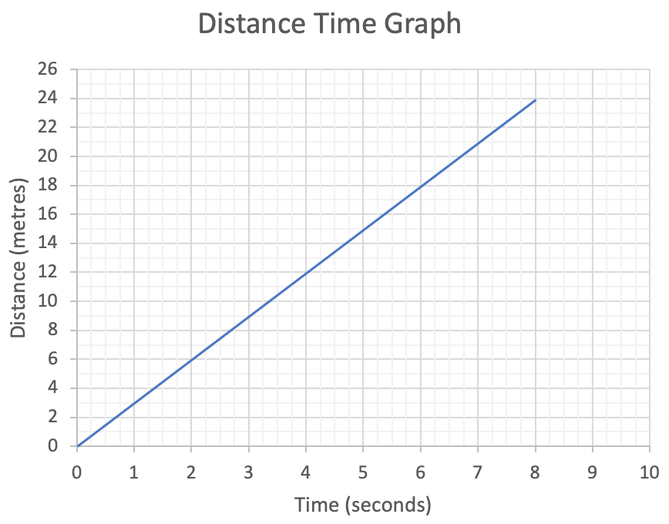
There are two different method that we can use to work out the speed on an object from a distance time graph. The first method is to find out the gradient of the line, and the second method is to use the formula at the top of this section. I am going to go through both of these methods starting with the gradient method.
Method 1
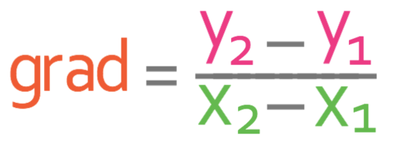
It is the gradient of the line on a distance time graph that represents the speed of an object. We are able to work out the gradient of a line by choosing two points that lie on the line. We then label the points and sub them into the gradient formula below:
Method 1
It is the gradient of the line on a distance time graph that represents the speed of an object. We are able to work out the gradient of a line by choosing two points that lie on the line. We then label the points and sub them into the gradient formula below:
We should always try to choose points where the coordinates are integers, or points that are on either major or minor grid lines. The two points that I have chosen are shown on the graph below.
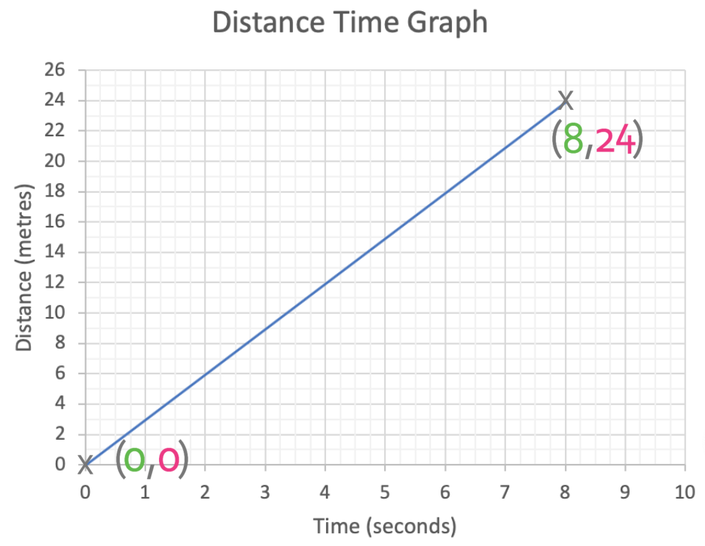
We label these points up.
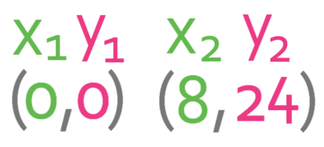
We now sub the values into the gradient formula.
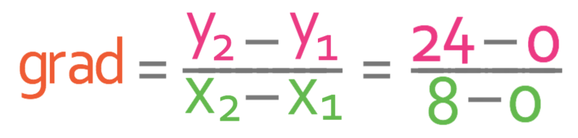
The numerator of the formula is working out the distance travelled, and the denominator of the formula is working out the time taken.
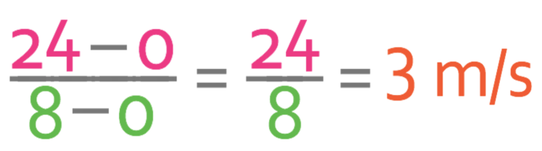
The gradient of the line is 3 and this means that the object is travelling at 3 metres per second (m/s).
Method 2
You may find it easier to work out the speed of an object by using the graph rather than the gradient formula. At the start of this section, we learnt that the formula for working out speed was:
Method 2
You may find it easier to work out the speed of an object by using the graph rather than the gradient formula. At the start of this section, we learnt that the formula for working out speed was:

I am going to use the start and end of the line. The distance covered between the start and end of the line is 24 metres and the time taken is 8 seconds.
We can now sub these values into the above formula; we sub in the distance as 24 and the time as 8.

This tells us that the speed of the object is 3 metres per second (m/s).
Example 2
We are given the distance time graph below. What is the speed of the object for the 3 different sections of the distance time graph? In which section is the object travelling the fastest?
We are given the distance time graph below. What is the speed of the object for the 3 different sections of the distance time graph? In which section is the object travelling the fastest?
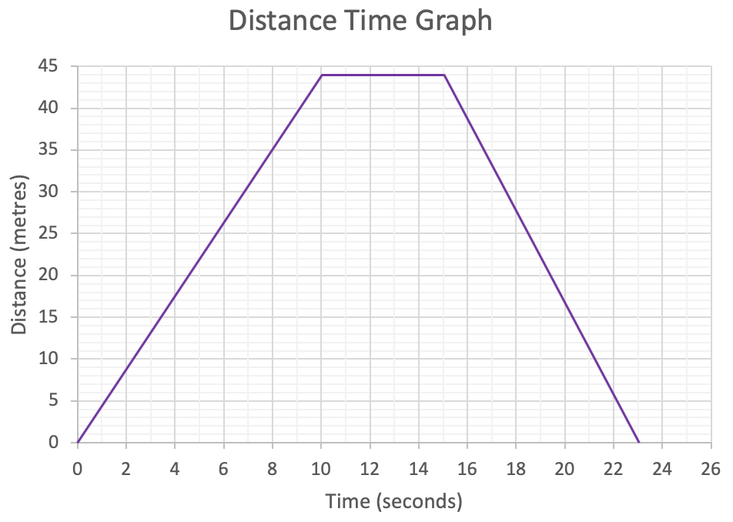
Here is a summary of the 3 different parts of the distance time graph:
Let’s now find the speed of the object at each of the 3 parts. All of the parts are straight, and this means that the object will have a constant gradient and therefore a constant speed throughout each of the 3 parts.
For the first part of the graph, the object travels 44 metres in 10 second. We can sub these values into the speed formula.
- For the first part of the graph, the gradient is positive, which means the object is travelling away from the starting point.
- For the second part of the graph, the line is flat (gradient 0), which means that the object is stationary.
- For the final part of the graph, the gradient is negative, which means that the object is travelling back to where it started from.
Let’s now find the speed of the object at each of the 3 parts. All of the parts are straight, and this means that the object will have a constant gradient and therefore a constant speed throughout each of the 3 parts.
For the first part of the graph, the object travels 44 metres in 10 second. We can sub these values into the speed formula.

The speed during the first section is 4.4 m/s.
The second part of the line is flat, which means the object is stationary and therefore has a speed of 0 m/s.
For the third and final part, the object travels 44 metres in 8 seconds (23 – 15). We can sub these values into the speed formula.
The second part of the line is flat, which means the object is stationary and therefore has a speed of 0 m/s.
For the third and final part, the object travels 44 metres in 8 seconds (23 – 15). We can sub these values into the speed formula.

The speed during the final section is 5.5 m/s.
We now have the speed of the object for each of the three different sections; the speed was 4.4 m/s for the first section, 0 m/s for the second section and 5.5 m/s for the final section.
The question also asked us to find the fastest section, which is the final section when the object is travelling back to the starting point.