Back to P5 Home
P5 N) Velocity Time Graphs – Part 1
P5 N) Velocity Time Graphs – Part 1
There are two different types of quantities; scalar and vector quantities.
A vector quantity has a magnitude and a direction. An example of a vector quantity is velocity, such as 5 m/s in a northwards direction; it has a magnitude (5 m/s) and a direction (a northwards direction).
A scalar quantity only has a magnitude and no direction. An example of a scalar quantity is speed, such as travelling at a speed of 40 mph (miles per hour). 40 mph has a magnitude, but there is no direction; are we travelling in a northwards direction? Are we travelling in circle etc. If we are travelling in a circle, the direction that we are travelling in is constantly changing and this means that the velocity will be constantly changing.
In the previous section, we look at distance time graphs. The x axis for distance time graphs was time and the y axis was distance away from the starting point.
Velocity time graphs have time on the x axis and velocity on the y axis. An example of a velocity time graph is shown below.
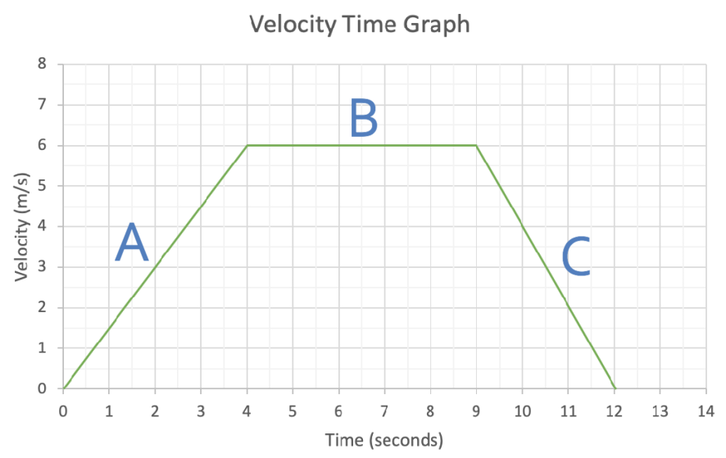
There are 3 different sections to this velocity time graphs.
Part A of this graph has a positive gradient (upwards sloping), which tells us that the object is accelerating (the velocity is increasing). We can tell this because at the start of part A, the object’s velocity was 0 m/s and at the end of part A, the object’s velocity was 6 m/s.
Part B of the velocity time graph is flat. This means that the object is travelling at a constant velocity of 6 m/s.
Part C has a negative gradient (downwards sloping), which means that the object is decelerating. We can tell that this is the case because at the start of part C (9 seconds), the object was travelling at 6 m/s and at the end of part C (12 seconds), the object was travelling at 0 m/s (the object had stopped).
Here are the rules for velocity time graphs:
- An upwards sloping line/ a positive gradient means that the object is accelerating
- A horizontal line means that the object is travelling at a constant velocity
- A downwards sloping line/ a negative gradient means that the object is decelerating
- A point that touches the x-axis means that the object is stationary
Area Under the Curve
The area under a velocity time graph represents the displacement, which is the distance from the starting point; for example, 200 m south. If the velocity is always positive for the velocity time graph, the displacement will be the same as the distance travelled.
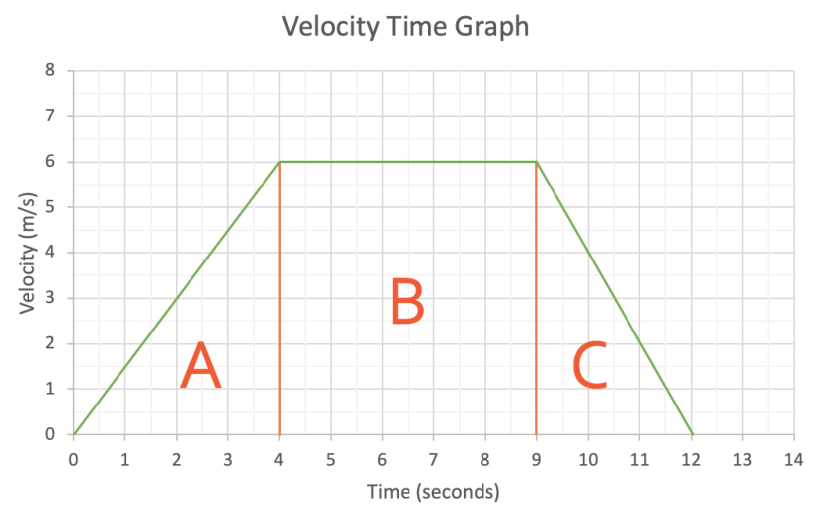
Let’s now work out the distance travelled by the object in the above velocity time graph. I am going to split the area under the velocity time graph up into 3 different pars; part A, part B and Part C. I am then going to work out the areas of each of the parts seperately.
The area under a velocity time graph represents the displacement, which is the distance from the starting point; for example, 200 m south. If the velocity is always positive for the velocity time graph, the displacement will be the same as the distance travelled.
Let’s now work out the distance travelled by the object in the above velocity time graph. I am going to split the area under the velocity time graph up into 3 different pars; part A, part B and Part C. I am then going to work out the areas of each of the parts seperately.
Part A is a triangle and we work out the area of a triangle using the formula:

Part A has a base of 4 and a height of 6.
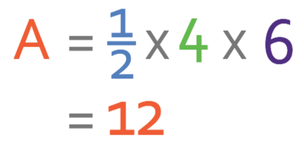
The area of part A is 12 and this represents 12 metres.
Part B is a rectangle, so we multiply the length by the width. The formula is shown below:
Part B is a rectangle, so we multiply the length by the width. The formula is shown below:

We work out the length of the rectangle by taking the time at the start away from the time at the end; 9 – 4 = 5. This tells us that the length of the rectangle is 5. The width of the rectangle is 6. We sub in the length as 5 and the width as 6 into the formula.
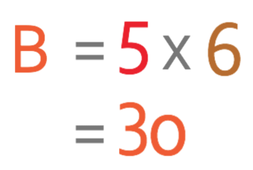
The area of B is 30 m.
Part C is a triangle. The base of part C is 3 (12 – 9) and the height is 6.
Part C is a triangle. The base of part C is 3 (12 – 9) and the height is 6.
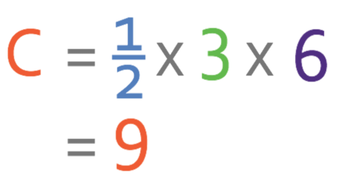
The area of C is 9 m.
We work out the total distance travelled by adding the three different areas together.
We work out the total distance travelled by adding the three different areas together.
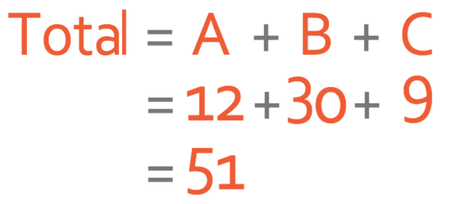
The total distance travelled by the object is 51 m.
Using the Area of a Trapezium Formula
You may have noticed that the shape created by the velocity time graph line and the x-axis is a trapezium. We are able to work out the area of a trapezium by using the formula below:
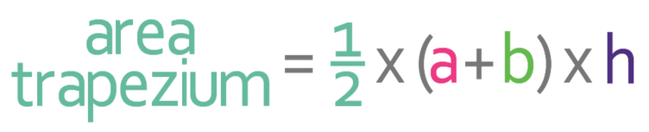
a and b in the formula above are the lengths of the two parallel sides. It does not matter which of the parallel sides is a and which of the parallel sides is b; I usually have a as the top and b as the bottom.
h in the formula above is the height of the trapezium.
We now need to find the values for a, b and h from the velocity time graph, which is shown below.
h in the formula above is the height of the trapezium.
We now need to find the values for a, b and h from the velocity time graph, which is shown below.
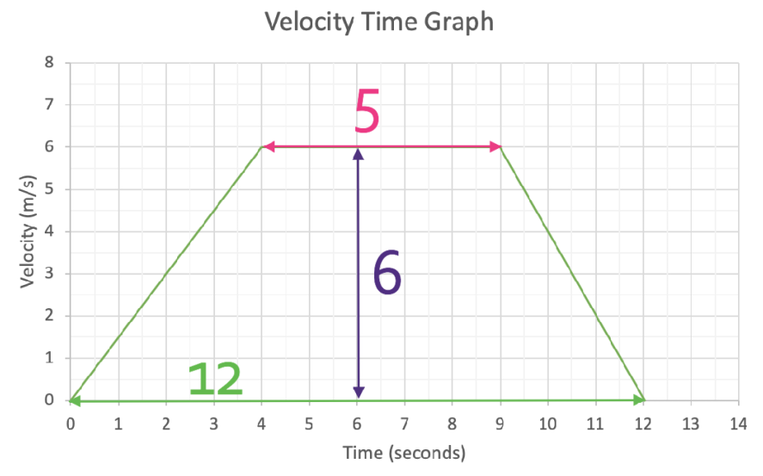
a for the trapezium above is 5, b is 12 and c is 6. We sub these values into the area of a trapezium formula:
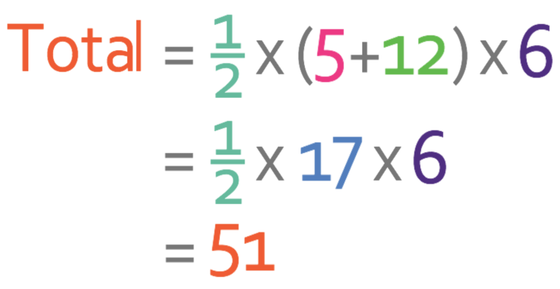
The distance travelled is 51 metres, which is exactly the same as the other method of working out the distance travelled.
It does not matter which method you use to work out the distance travelled; give both methods a try and see which one you prefer.
It does not matter which method you use to work out the distance travelled; give both methods a try and see which one you prefer.