Back to P5 Home
P5: Quiz 16 – Answers
P5: Quiz 16 – Answers
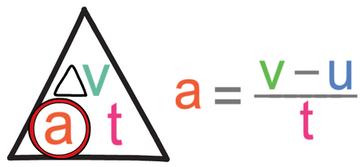
1) F = ma (or force = mass x acceleration). Force is measured in Newtons (N), mass is measured in kilograms (kg) and acceleration is measured in metres per second squared (m/s2)

2)
a) We add more masses onto the trolley and use the light gate to measure the rate of acceleration. We keep the force/ mass on the hanger constant throughout the experiment.
b) Mass and acceleration are inversely proportional to each other – a greater mass will result in a lower acceleration, and a lower mass will result in a greater acceleration
3)
a) We start with all of the masses on the trolley and complete the experiment. We then move the masses one by one from the trolley to the hanging hook, which increases the force. The light gate will measure the acceleration for each of the experiments
b) Force and acceleration are directly proportional to each other – a greater force will result in a greater acceleration, and a lower force will result in a lower acceleration
4) We can do the experiment on an air track (an air track is essentially like an air hockey table)
5) The ends of the card are higher up than the middle of the card. As the trolley passes through the light gate, these two higher bits of card will interrupt the light in the light gate. We measure the lengths of these higher bits of card and input the lengths into the light gate software on the laptop. The light gate software can work out the speed of the trolley by dividing the distance of the higher bits of card by the time that the light in the light gate is interrupted for.

The light gate will then have two speed values for the first and second higher bit of card. The light gate software can work out the acceleration by using the formula below.
6)
a)
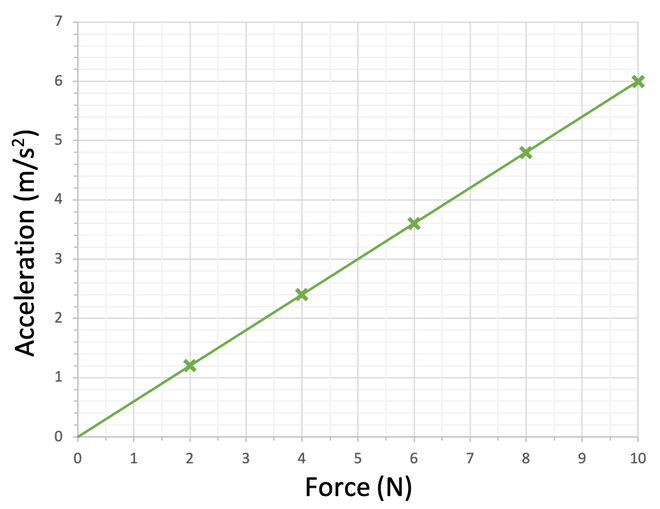
b) Force and acceleration are directly proportional to each other – a greater force will result in a greater acceleration, and a lower force will result in a lower acceleration
c) 1.67 kg
7)
a)
c) 1.67 kg
7)
a)
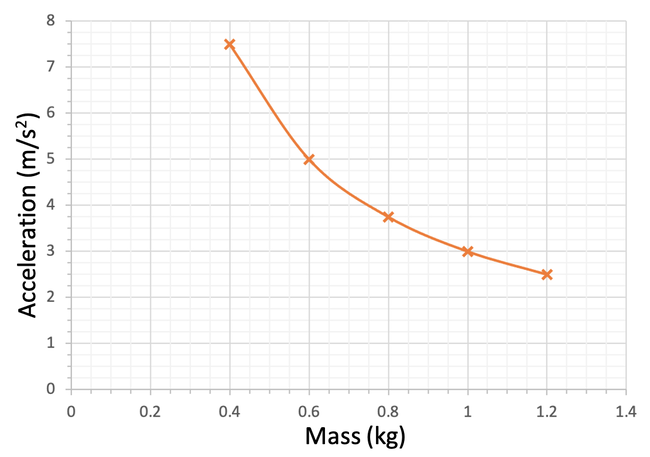
b) Mass and acceleration are inversely proportional to each other – a greater mass will result in a lower acceleration, and a lower mass will result in a greater acceleration
Questions
1) Write the equation for Newton’s second law – include the units for each of the variables.
2) We are able to use the apparatus below to investigate motion.
1) Write the equation for Newton’s second law – include the units for each of the variables.
2) We are able to use the apparatus below to investigate motion.
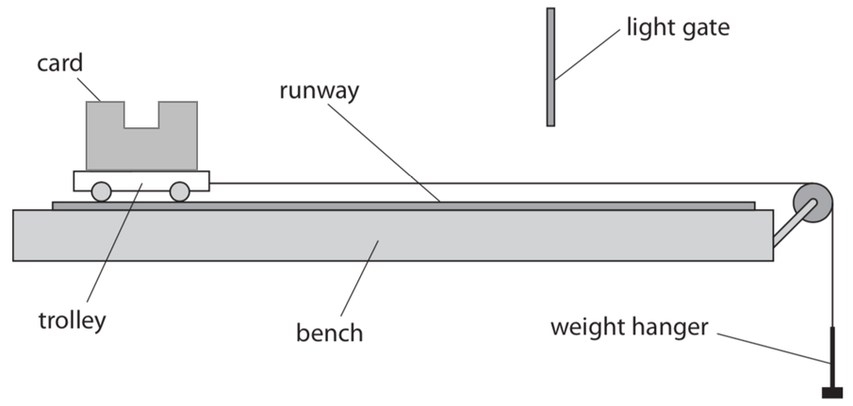
a) How can we use the apparatus above to investigate the effect that mass has on acceleration?
b) Describe the relationship that we will observe between mass and acceleration.
3)
a) Using the same apparatus as question 2, how can we use the apparatus to investigate the effect that force has on acceleration?
b) Describe the relationship that we will observe between force and acceleration.
4) Friction is a resistive force. How can we modify the experiment to eliminate/ reduce the effect of friction?
5) Describe how a single light gate measures the acceleration of the trolley. Talk about the shape of the piece of card and the two equations that are used.
6) A student completed an experiment to investigate the effect that force has on acceleration. Her results are shown in the table below.
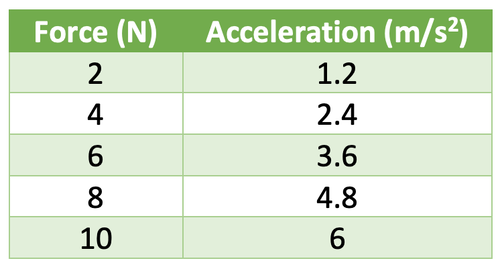
a) Plot the values for force and acceleration on the graph below and draw a line of best fit.
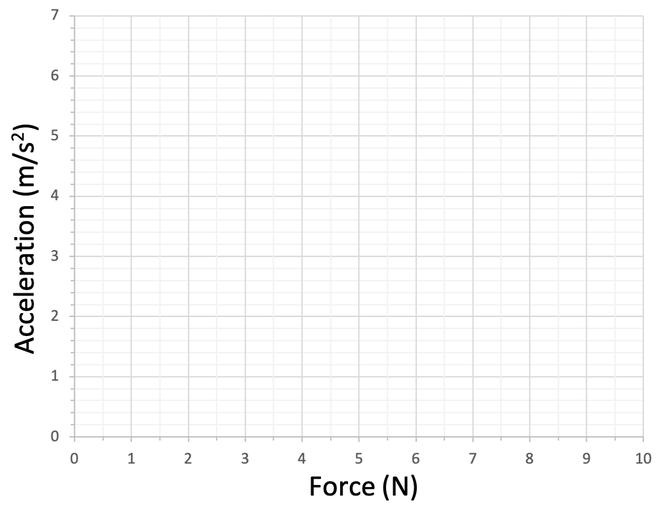
b) Describe the relationship between the force and acceleration.
c) Use your graph to calculate the mass of the system. Give your answer to 2 decimal places. Hint: pick a point on the graph or in the table and sub the values into F = ma – then solve to find m.
7) A student completed an experiment to investigate the effect that mass has on acceleration. Her results are shown in the table below.
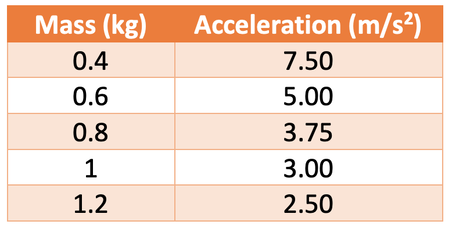
a) Plot the values for mass and acceleration on the graph below and draw a curve of best fit.
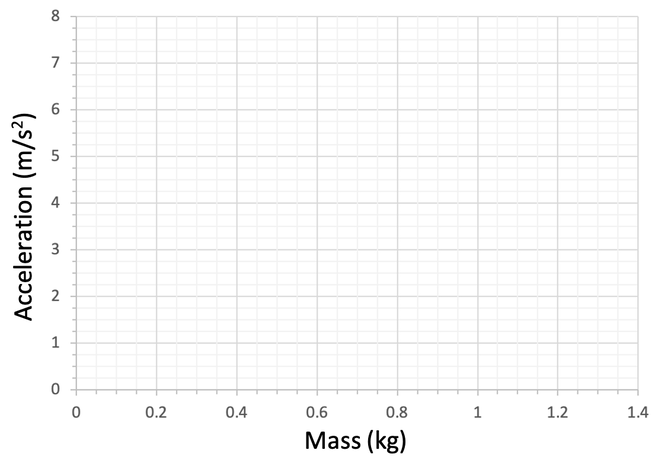
b) Describe the relationship between mass and acceleration.