Back to C6 Home
C6: Quiz 2 – Answers
C6: Quiz 2 – Answers
1)
a) We monitor how the mass changes over time; we would take readings from the mass balance every 15 seconds (or at some other regular interval). The gas that is produced by the reaction will bubble up to the surface and escape into the air in the room. This results in the mass of the conical flask decreasing over time. We then work out the mass lost for all of our values. After doing this, we draw a rate of reaction graph by plotting our time values against mass lost
b) Mass will be lost quicker – a greater rate of reaction will produce more gas in a given period of time (produce gas more quickly). This will result in the mass being lost quicker
c)
i) The curved part
ii) The flat part
2)
a) To undertake this experiment, we draw a cross (X) on a bit of paper and place it underneath the conical flask where the reaction will take place. We then pour the two solutions into the conical flask. The solutions will start reacting, which will produce a precipitate thus resulting in the solution becoming cloudy. Throughout the reaction, we look down the top of the conical flask at the cross that we drew, and time how long it takes for us to be unable to see the cross under the conical flask
b) No – we cannot draw a graph from this experiment
3)
a) The gas that is given off from the reaction will cause the gas syringe to move. We monitor how the volume of gas in the gas syringe changes over time; we would take readings for the volume of gas every 15 seconds. After obtaining our values, we can draw a rate of reaction graph by plotting our values for time and volume of gas produced on a graph
b)
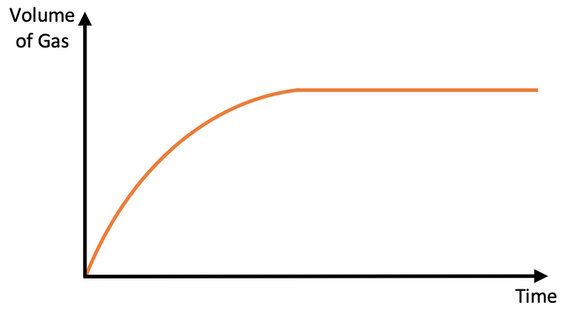
c) Start – the rate of reaction is the fastest at the start
Questions
1) The apparatus below can be used to measure the rate of reaction when a gas is produced.
1) The apparatus below can be used to measure the rate of reaction when a gas is produced.
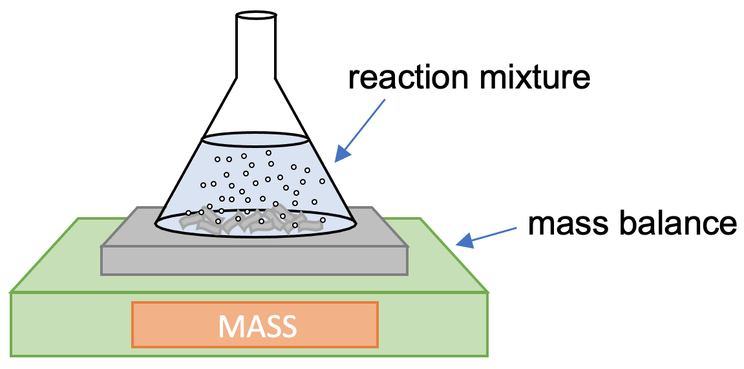
a) Describe how the above apparatus can be used to draw a rate of reaction graph.
b) If there is a greater rate of reaction, will the mass be lost quicker or more slowly?
c) The rate of reaction graph for this experiment is shown below.
b) If there is a greater rate of reaction, will the mass be lost quicker or more slowly?
c) The rate of reaction graph for this experiment is shown below.
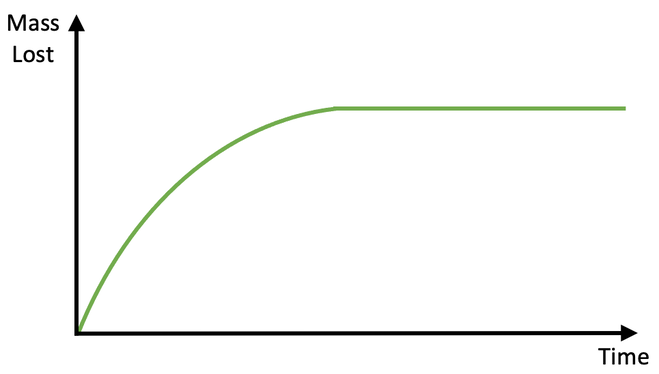
i) When are reactions taking place; the curved part or the flat part?
ii) When have the reactions stopped; the curved part or the flat part?
2) The apparatus below can be used to measure the rate of reaction when a precipitate is formed.
ii) When have the reactions stopped; the curved part or the flat part?
2) The apparatus below can be used to measure the rate of reaction when a precipitate is formed.
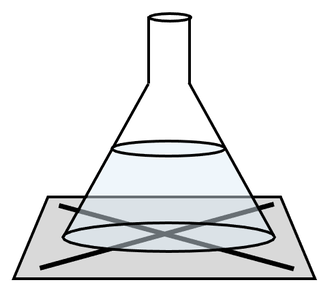
a) Describe how the above apparatus can be used to work out the rate of reaction.
b) Can we draw a graph for the rate of reaction from this experiment; yes or no? You do not need to explain your answer.
3) The apparatus below can be used to measure the rate of reaction when a gas is produced.
b) Can we draw a graph for the rate of reaction from this experiment; yes or no? You do not need to explain your answer.
3) The apparatus below can be used to measure the rate of reaction when a gas is produced.
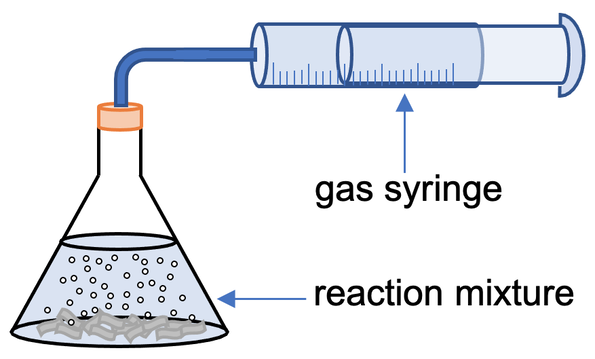
a) Describe how the above apparatus can be used to work out the rate of reaction.
b) We can draw a rate of reaction graph from this experiment. Draw what the graph looks like. Make sure that you label the x and y axis.
c) On the graph that you have just drawn, where is the rate of reaction the fastest; the start, middle or end?
b) We can draw a rate of reaction graph from this experiment. Draw what the graph looks like. Make sure that you label the x and y axis.
c) On the graph that you have just drawn, where is the rate of reaction the fastest; the start, middle or end?