C7 C) Rate of Reaction Graphs
- Temperature – a higher temperature means a greater rate of reaction. This is because the particles have more kinetic energy, which means that they move around faster resulting in more frequent collisions. Also, a greater temperature means that the energy transferred during a collision is larger, which is more likely to be greater than the activation energy, thus meaning that more reactions take place (if the activation energy is not satisfied, a reaction will not take place).
- Concentration and pressure – a greater concentration or pressure results in a greater rate of reaction because the particles are closer together, which means that there are more frequent collisions and therefore a greater rate of reaction.
- Surface area to volume ratio – a greater surface area for a given volume increases the rate of reaction because there is a greater surface area for the particles to collide upon, which leads to more frequent collisions and therefore a greater rate of reaction.
We are able to see the effect that these factors have on the rate of reaction by undertaking some experiments and comparing the results.
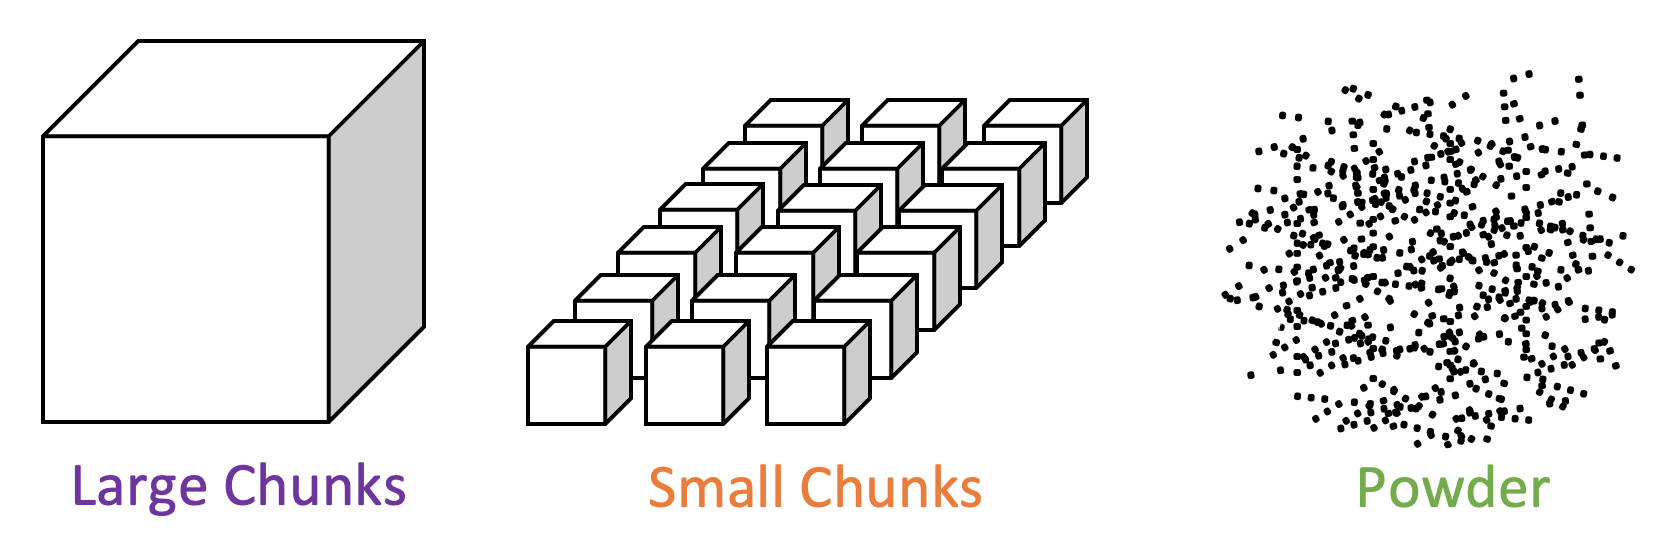
We can investigate the effect that surface area has on the rate of reaction by undertaking an experiment with 3 different forms of a reactant; for example, large chunks, small chunks and powder.
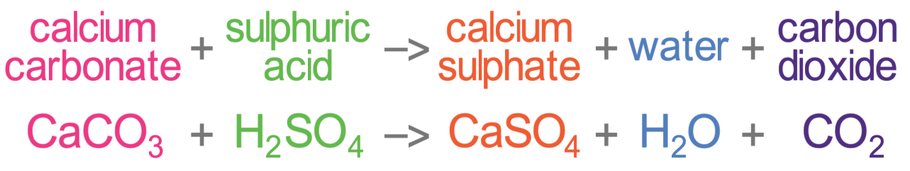
We can use the reaction of calcium carbonate and sulphuric acid to see the effect that surface area has on the rate of reaction. Calcium carbonate will react with sulfuric acid to produce calcium sulphate, carbon dioxide and water. The word and symbol equation for this reaction are shown below.
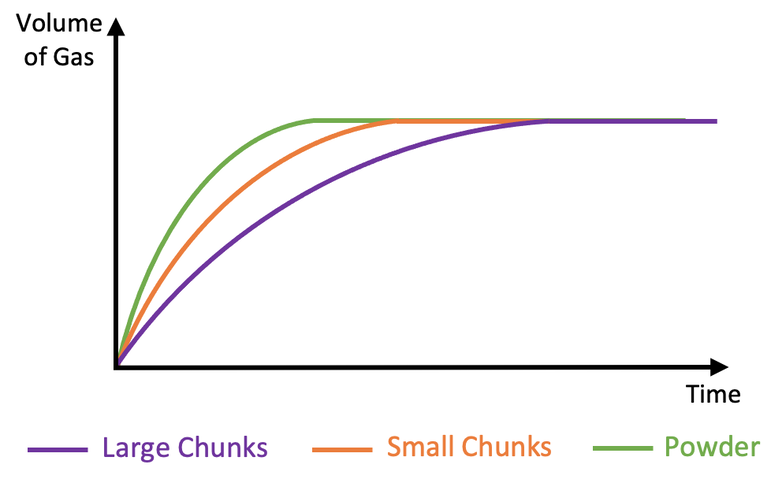
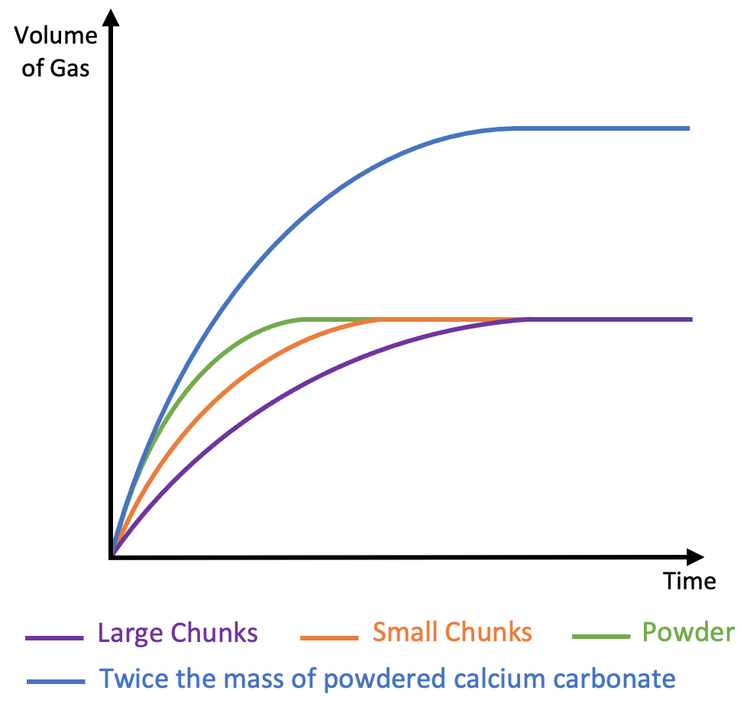
- The first section is where the calcium carbonate is reacting. Whilst the calcium carbonate is reacting, carbon dioxide is being produced, which means that the volume of gas is increasing. This is why the graphs are curved for the first part.
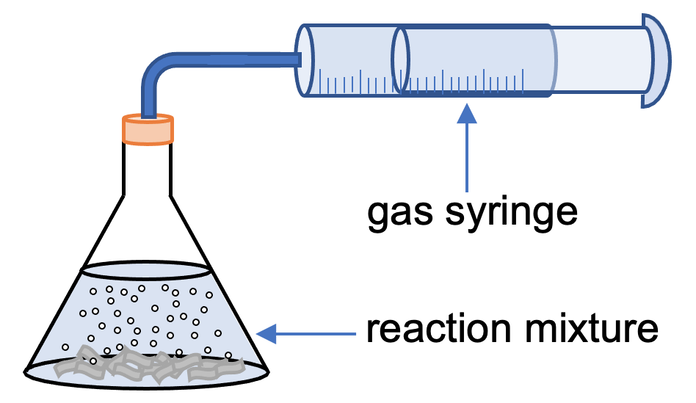
- The second part is where the graphs are straight/ horizontal. When the line is horizontal it means that the reaction is over. At this point all of the calcium carbonate has reacted, thus meaning that no more reactions are taking place. As no reactions are taking place, no more carbon dioxide is being produced, thus meaning that the volume of gas in the gas syringe stays constant, hence why the line is straight.
The 3 curves for the different forms have different gradients on the first section. A steeper gradient means that gas is being produced quicker and therefore indicates a greater rate of reaction. From the graph, we can see that the powdered calcium carbonate has the steepest gradient, then small chunks of calcium carbonate and the slowest rate of reaction is the large chunks of calcium carbonate.
For the above graph/ previous experiment, all 3 of the different forms of calcium carbonate had the same mass and this is why they all produce the same volume of gas after all of the calcium carbonate has reacted. All 3 of the curves flatten out at the same volume of gas.
If we were to undertake a fourth reaction with powdered calcium carbonate and twice as much mass, we would observe what is shown on the graph below.
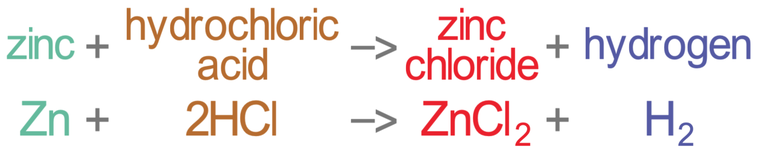
If we were to investigate the effect that temperature has on the rate of reaction, we complete a reaction at 3 different temperatures (20°C, 40°C and 60°C) and measure the outcomes. I am going to investigate the rate of reaction for the reaction of zinc and hydrochloric acid. The word and symbol equation for this reaction are shown below.
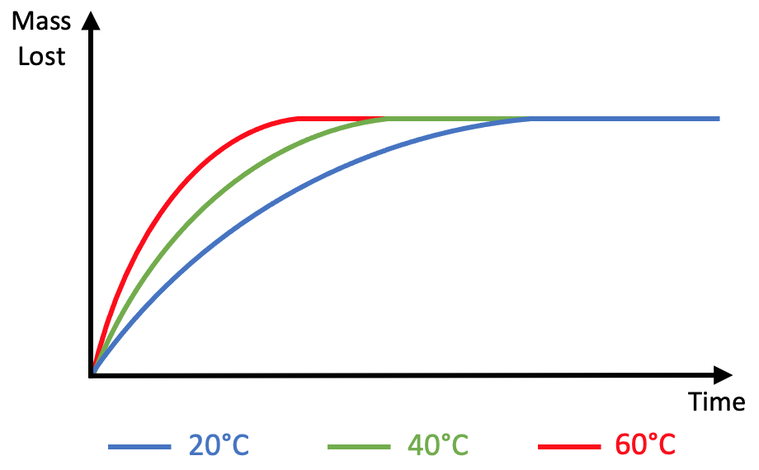
Like before, the steeper the curve is, the greater the rate of reaction. The curve is the steepest for the reaction that took place at 60°C and this is because 60°C is the highest of the 3 temperatures. At 60°C, the particles have the most kinetic energy, which means that the particles move around the fastest, which leads to more frequent collisions and a greater rate of reaction (the collisions at 60°C are the most frequent). Also, at 60°C, the particles are moving faster so are more likely to transfer enough energy during a collision to satisfy the activation energy, thus resulting in a reaction taking place.
The lowest rate of reaction is the reaction that took place at 20°C – it has the flattest curved part on the graph.
If we want to see what effect concentration has on the rate of a reaction, we can undertake a reaction at different concentrations. I am going to investigate the effect that concentration has on the rate of reaction by using the reaction of sodium thiosulfate and hydrochloric acid. The word and symbol equation for this reaction is shown below.
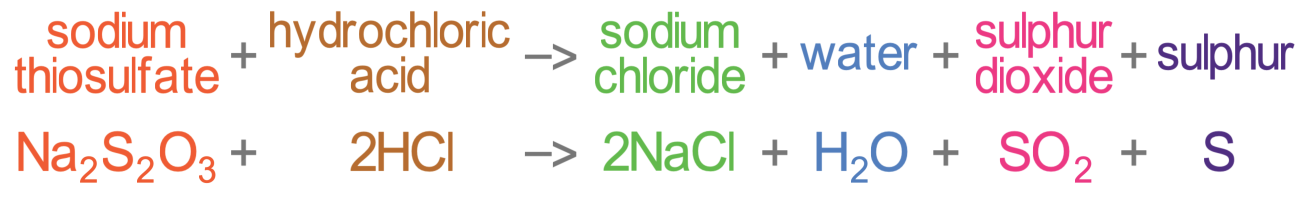
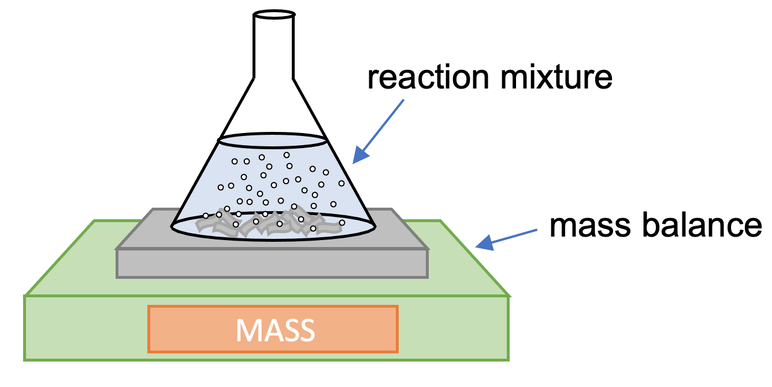
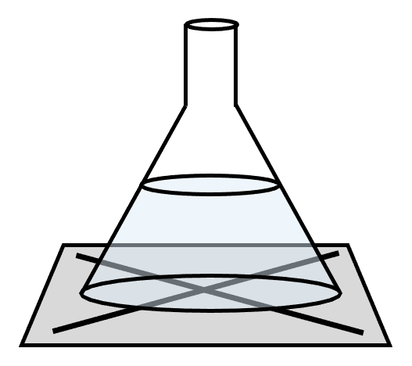
Sodium thiosulfate and hydrochloric acid will react and produce a precipitate, which will cause the solution to go cloudy. The solution will go cloudy because of the sulfur produced during the reaction. We can measure the rate of reaction for this reaction by placing the conical flask that the reaction will take place in above a cross (X) drawn on a piece of paper. We then look down the conical flask and time how long it takes for the cross to disappear. The faster the cross disappears, the greater the rate of reaction is. The apparatus will look like what is shown below:
We will complete the experiment with a few different concentrations of hydrochloric acid, such as 0.5 mol/dm3, 1 mol/dm3, 1.5 mol/dm3 etc. My results for the time taken for me to be unable to see the cross on the paper underneath the conical flaks are shown below.
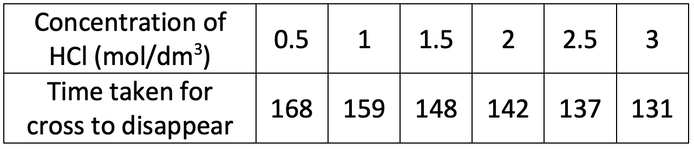
From the above table, we can see that the stronger the acid is, the faster it is for the cross to disappear; the cross only took 131 seconds for a concentration of 3 mol/dm3, whereas the cross took 168 seconds for a concentration of 0.5 mol/dm3. This is because a more concentrated acid has more particles in a given volume, which leads to more frequent collisions and therefore a greater rate of reaction; this is why the precipitate is produced the fastest.