14.3 - 2015 June Q7 Answers
(a) The bar graph shows the levels of deforestation and carbon dioxide (CO2) emissions each year in the Brazilian Amazon between 2005 and 2011.

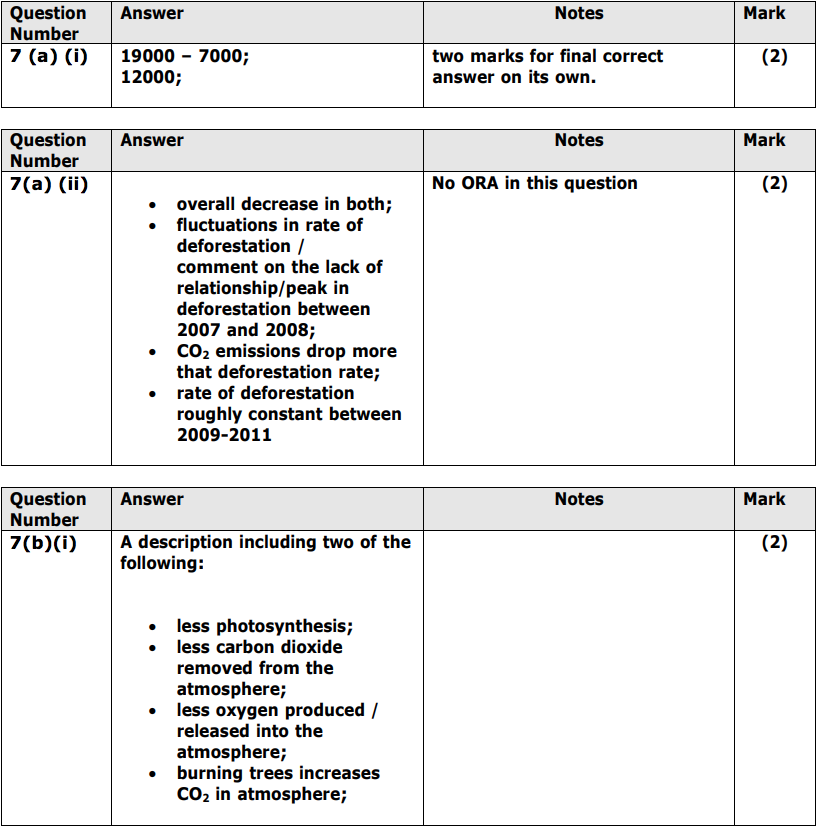
(i) Calculate the difference in the level of deforestation in 2011 compared with the level in 2005. (2)
difference = .................................................................... km2
(ii) Use the bar graph to compare the trends in deforestation and CO2 emissions between 2005 and 2011. (2)
(b) (i) Describe how deforestation can lead to a greater imbalance of oxygen and carbon dioxide in the atmosphere. (2)
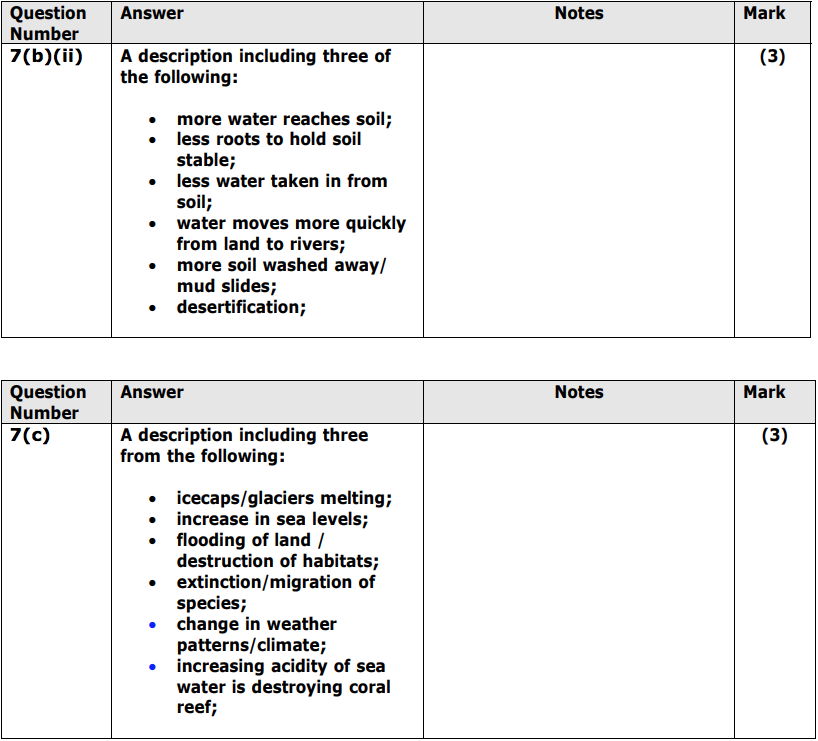
(ii) Describe how deforestation leads to soil erosion. (3)
(c) Excess carbon dioxide in the atmosphere can lead to global warming. Describe the consequences of global warming. (3)
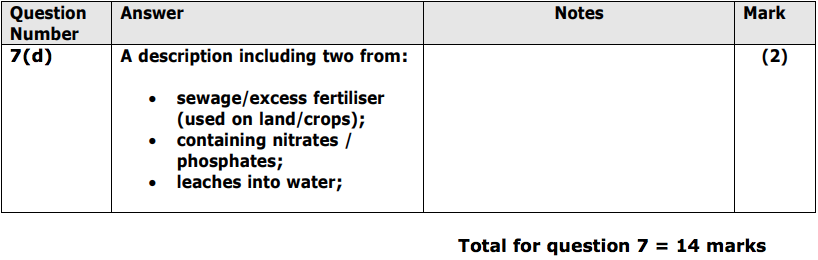
(d) Eutrophication is another environmental problem. Describe how eutrophication might occur in some lakes. (2)
(b) (i) Describe how deforestation can lead to a greater imbalance of oxygen and carbon dioxide in the atmosphere. (2)
(ii) Describe how deforestation leads to soil erosion. (3)
(c) Excess carbon dioxide in the atmosphere can lead to global warming. Describe the consequences of global warming. (3)
(d) Eutrophication is another environmental problem. Describe how eutrophication might occur in some lakes. (2)
Answers