Back to AQA Maths Foundation June 2019 Paper 2 Home
Q16: Question – Paper 2 – June 2019
Q16: Question – Paper 2 – June 2019
Helpful Links
Question
Click here for a printable version of this question!
16)
The graph below is used to convert between
16)
The graph below is used to convert between
- temperature in degrees Fahrenheit (F)
and - temperature in degrees Celsius (C).
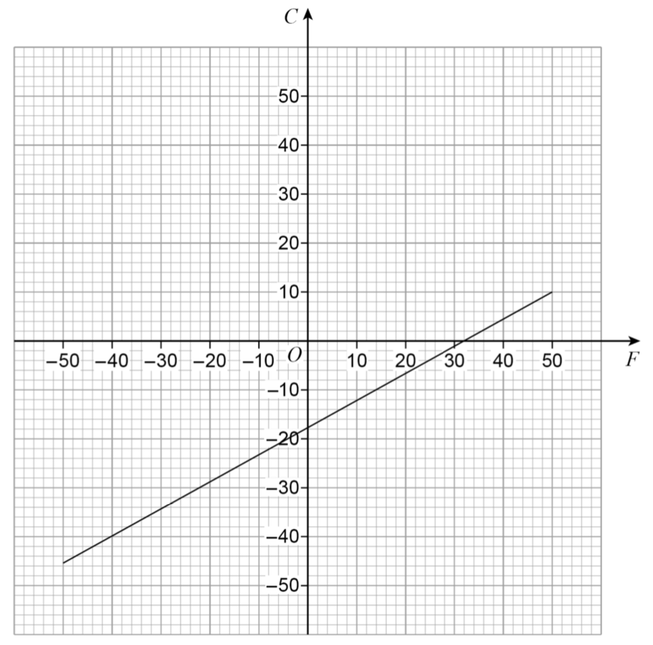
a) Use the graph to convert 40 degrees Fahrenheit into degrees Celsius.
[1 mark]
At one temperature, T,
the number of degrees Celsius is double the number of degrees Fahrenheit.
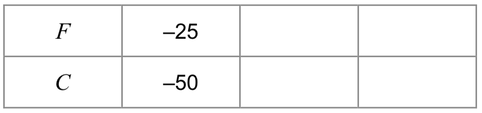
The graph of C = 2F can be drawn to help find this temperature.
b) On the grid opposite, draw the graph of C = 2F for values of F from –25 to 25
You may use the table to help you.
[2 marks]
c) Use your graph to estimate the value of T.
Give your answer in degrees Celsius.
[2 marks]