Back to Edexcel Maths Higher June 2019 Paper 3 Home
Q4: Question – Paper 3 – June 2019
Q4: Question – Paper 3 – June 2019
Question
4)
Sean has drawn a time series graph to show the numbers, in thousands, of visitors to a fun park.
Sean has drawn a time series graph to show the numbers, in thousands, of visitors to a fun park.
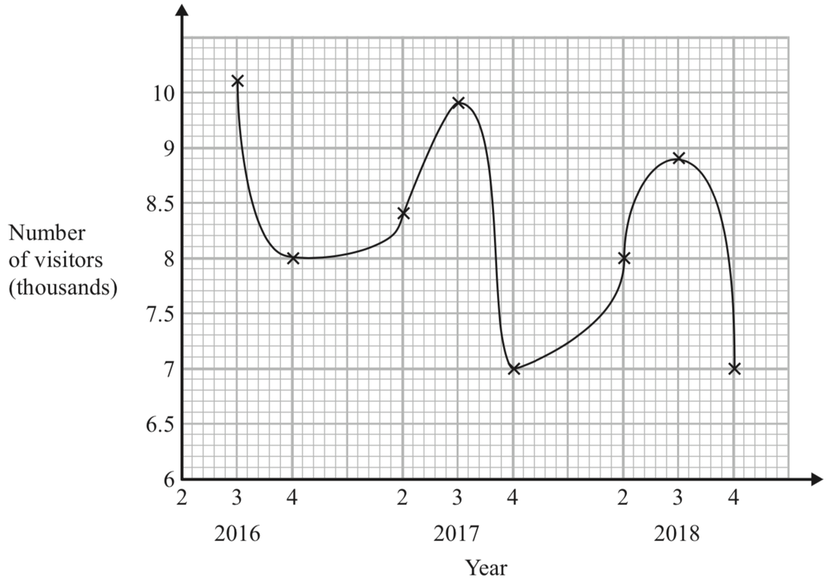
Write down two things that are wrong or could be misleading with this graph.
[2 marks]