1.3. PRODUCTION POSSIBILITY FRONTIER
|
This video is relevant for this section despite it saying that it is for AQA.
|
Positive & Normative Statements
|
The production possibility frontier is a graphical representation of the combination of two goods that an economy can produce with a given level of resource.
|
The resources are the factors of product – land, labour and capital. It is an over simplification of the whole economy because in reality economies produce hundreds of thousands of goods, and this model makes the assumption that the economy only produces two. These two goods can be anything. Examples are:
- Guns and butter
- Wine and cotton
- Ice cream and refrigerators
 What combination of wine and cotton the economy can produce if all resources in the economy were used.
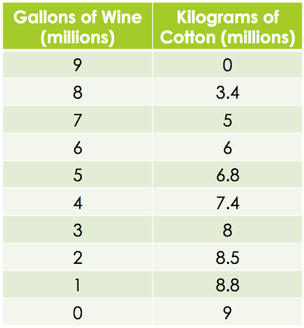
The chart below shows the combinations of wine and cotton that we can produces using all of our factors of production.
Cotton and wine were the two goods that this economy produces. If all of the resources were devoted towards wine production, then we could produce 9 million gallons of wine and no cotton (as no resources have been devoted to cotton production). Alternatively, we can devote all resources to cotton production and produce 9 million kilograms of cotton and no wine. We could also produce both goods, such as 6 million gallons of wine and 6 million kilograms of cotton. We can use the details in this table to plot a PPF curve.
Any point on the PPF curve (the green line) will be using the maximum amount of resources available in the economy. If we are at a point on this PPF curve, then the economy is being productively efficient, as we cannot produce more of one good without producing less of the other good. Point s and x represent this.
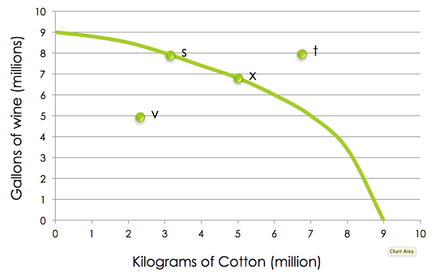 The PPF curve for our economy. Draw out from our table above.
Any point below the PPF curve and between the two axes is obtainable but is not productively efficient. This is because not all resources are being used. Point V is a productively inefficient point. This economy could move from point v to s or x without having to sacrifice any quantity of cotton or wine, therefore it is in this economy’s interests to move to the boundary and become productively efficient.
Any point outside the PPF boundary is unattainable. This is because at the moment we do not have the resources or the technologies to produce the combination of goods. Point t is an example of an unattainable point.
Like I said, any point on the PPF curve is productively efficient. But is it allocatively efficient? Allocative efficiency is where the current combinations of goods and services produced and sold, give the maximum level of satisfaction for each consumer at their given level of income. This would occur when the price of goods is equal to the marginal benefit (will be discussed in the next section). The PPF curve cannot tell us anything about the preferences of individuals so we cannot see if the economy is being allocatively efficient.
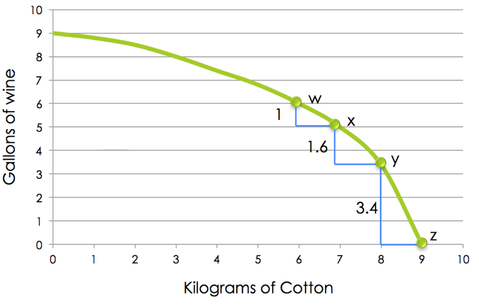 The same PPF as before. The opportunity cost increases as we move closer to out maximum output due to diminishing returns.
Why is the PPF curve this shape?
The PPF curve is concave because of the diminishing marginal returns. This will be covered more in the production part, which is section 3. Diminishing marginal returns is where you receive less for another input. For example, if you add one more worker to a production process and he increases output by 10. Suppose now that we added one more worker to this production process but instead of producing 10 extra units of output he only produces 8. We then add another worker and rather than producing 8 he only produces 5. In this case adding an extra worker (the marginal worker) does not increase output by the same amount. Instead we see diminishing (falling) marginal returns. Every time I add an additional worker to the production process, output increases by less and less.
Diminishing returns occurs in the whole economy. As the economy continues to use more factors of production for a good, its output it receives for the additional factors of production is less and less. This results in there being increasing opportunity costs.
Between points w, x, y and z, there is an increase in production of cotton by 1kg. But what is the opportunity cost of this increase in production of cotton by 1 kilo? The opportunity cost looks at the best alternative; what you could have had if I used these factors of production to produce wine instead of 1 kg of cotton. From w to x we have to give up 1 gallon. From x to y we have to give up slightly more (1.6) and from y to z we have to give up even more (3.4 gallons). This is the increasing opportunity cost.
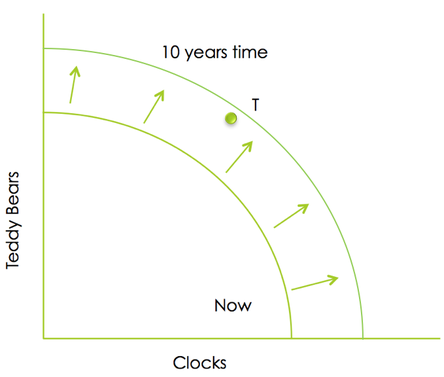 Economic growth is represented by an outwards shifts of the PPF curve.
Economic Growth
In the first diagram, point t was currently unattainable. However, over time the economy changes. More resources can found, new technologies can be invented and firms carry out investment. All of these have an effect on the productive potential of the economy. Suppose there was to be an increase in technology, which increased efficiency in the economy. This would mean that the same level of resources could produce more output (more wine and more cotton). This would be represented by an outwards shift of the PPF cure. Furthermore, suppose that we had an increase in one of the factors of production. This increase could be in the supply of labour through immigration. As the labour supply has increased the economy can now produce more and this is again represented by an outwards shift of the PPF curve.
In addition to positive effects, we can also have negative effect on the productive potential of the economy. One affect could be a war that destroys a large amount of capital (such as factories and machines). This means that the economy cannot produce as much as it could before. On the diagram this is represented by an inwards shift of the PPF curve.
Economic growth is represented by an outwards shifts of the PPF curve.
The graph below represents a positive effect on the productive potential of the economy. Now point t can be achieved. This point is productively efficient but we do not know if it is allocatively efficient, as we have not taken into account the preferences of each individual consumer.