Back to AQA Maths Higher June 2017 Paper 1 Home
Q19: Answers – Paper 1 – June 2017
Q19: Answers – Paper 1 – June 2017
Helpful Links
Mark Scheme
Working
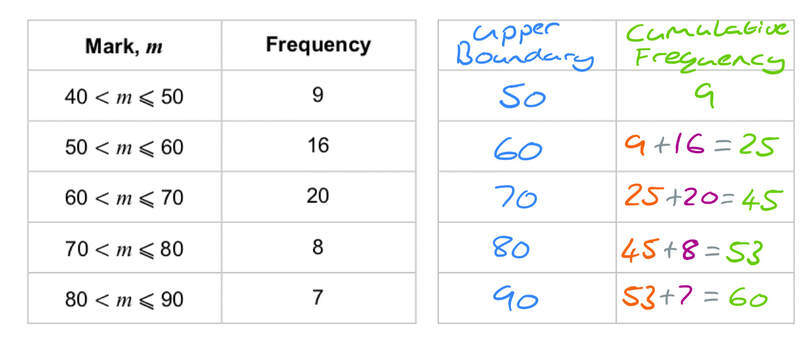
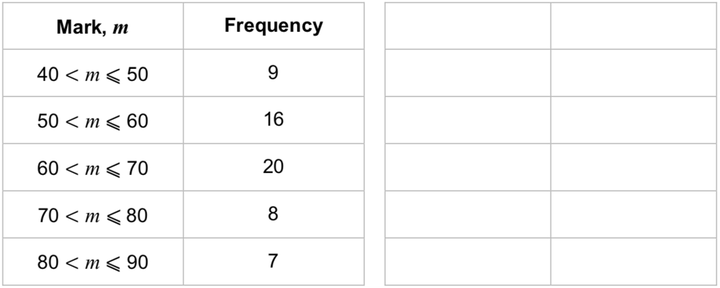
Here is some information about the marks of 60 students in a test.
Here is some information about the marks of 60 students in a test.
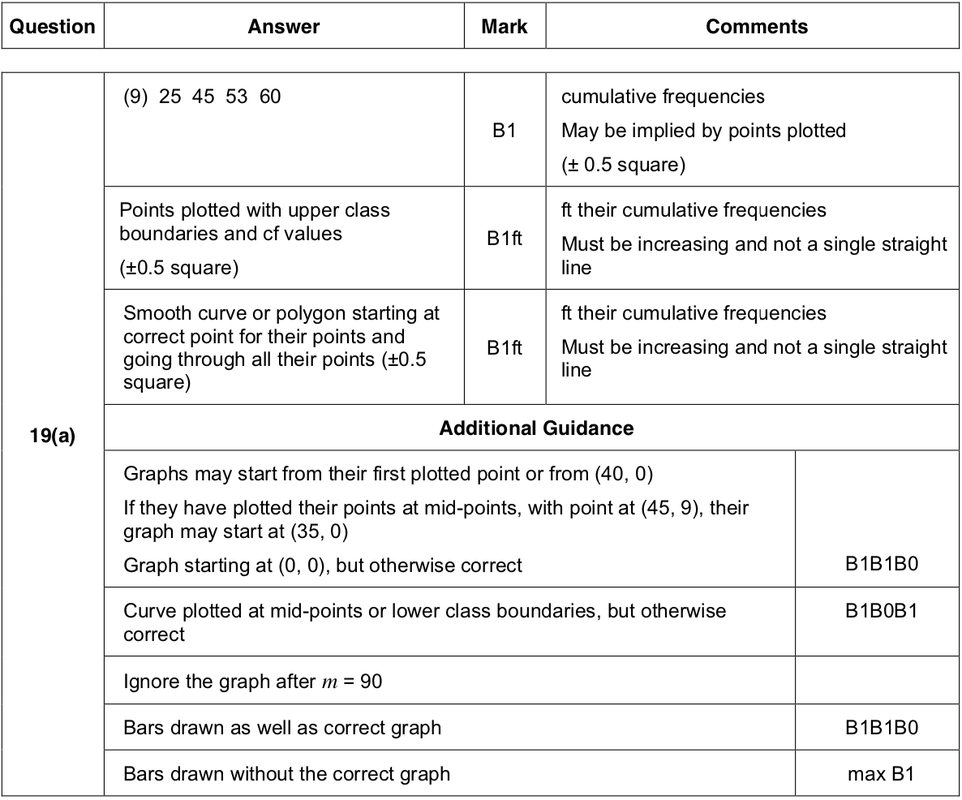
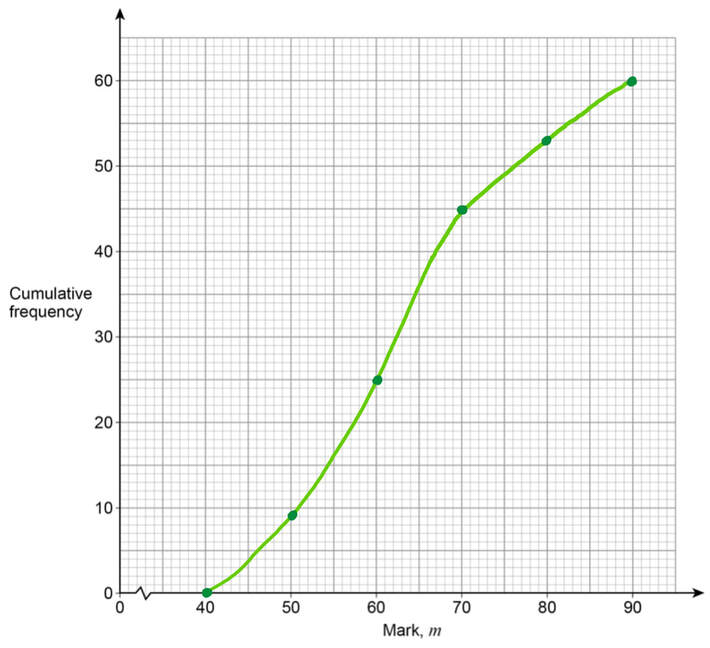
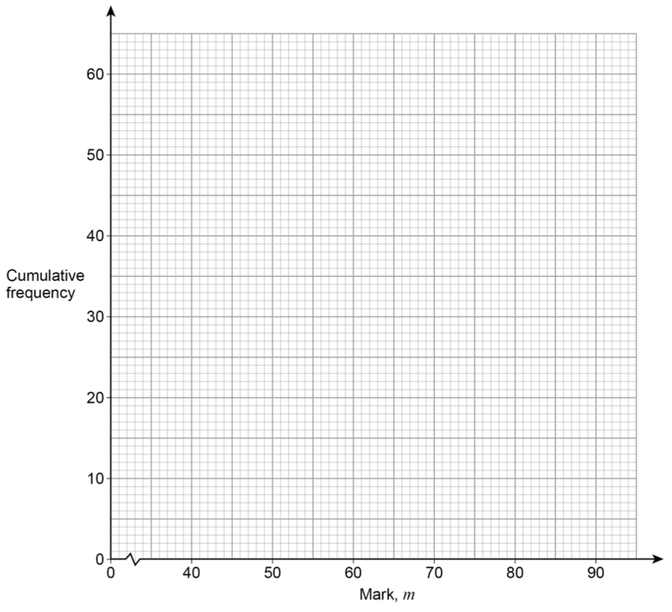
a) On the grid, draw a cumulative frequency graph.
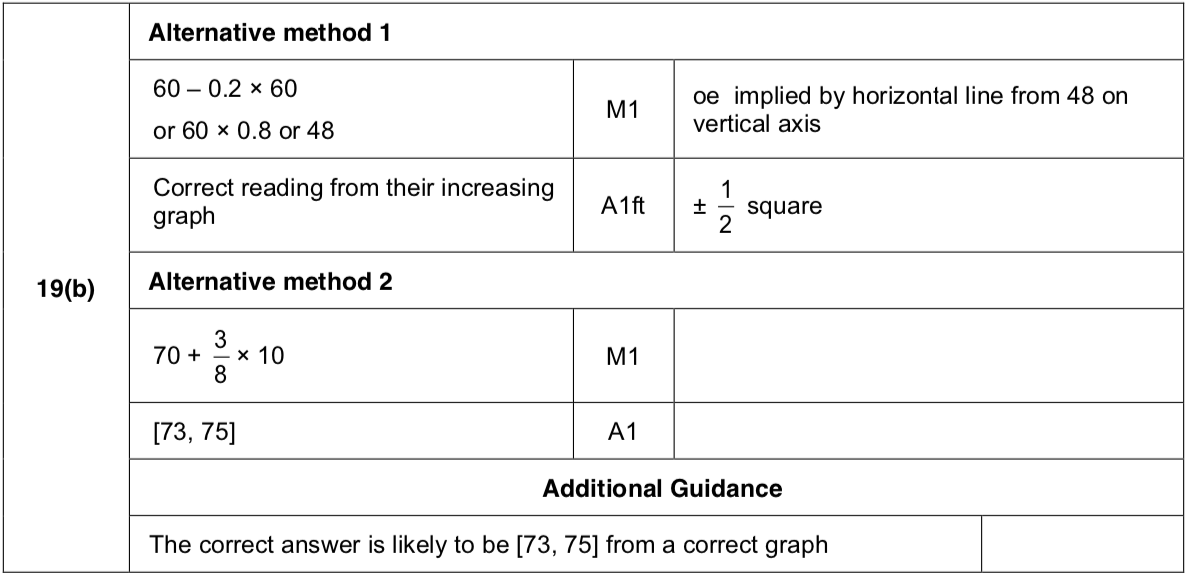
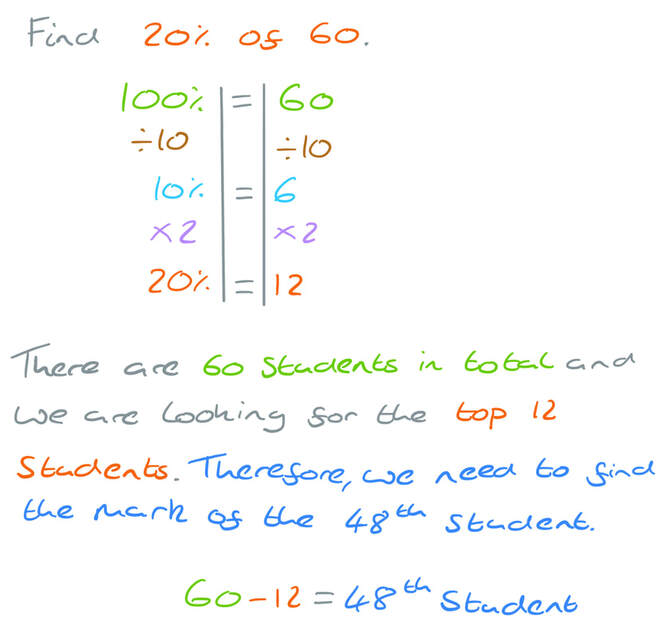
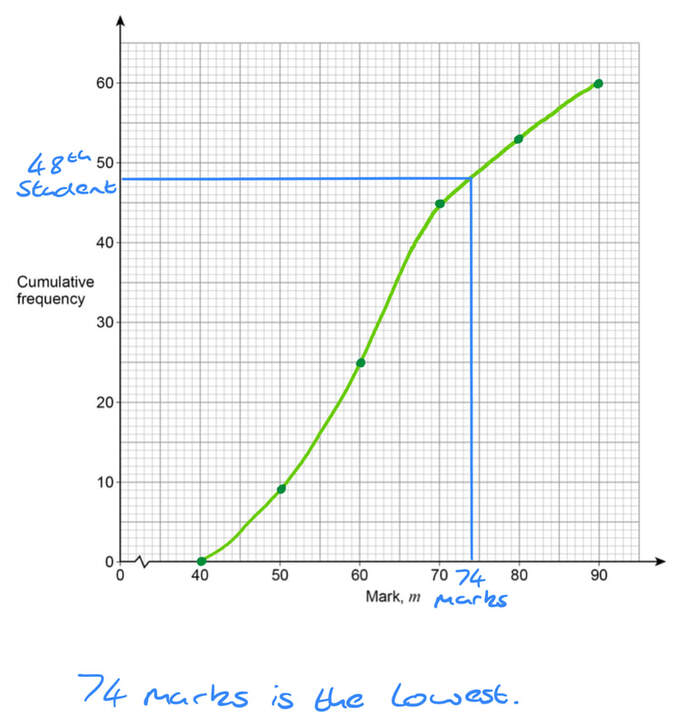
b) Use your graph to estimate the lowest mark of the top 20% of students.
Question
Click here for a printable version of this question.
19)
Here is some information about the marks of 60 students in a test.
19)
Here is some information about the marks of 60 students in a test.
a) On the grid, draw a cumulative frequency graph.
[3 marks]
b) Use your graph to estimate the lowest mark of the top 20% of students.
[2 marks]