Back to AQA Maths Foundation November 2018 Paper 3 Home
Q9: Answers – Paper 3 – November 2018
Q9: Answers – Paper 3 – November 2018
Helpful Links
Mark Scheme
Working
A company sells houses.
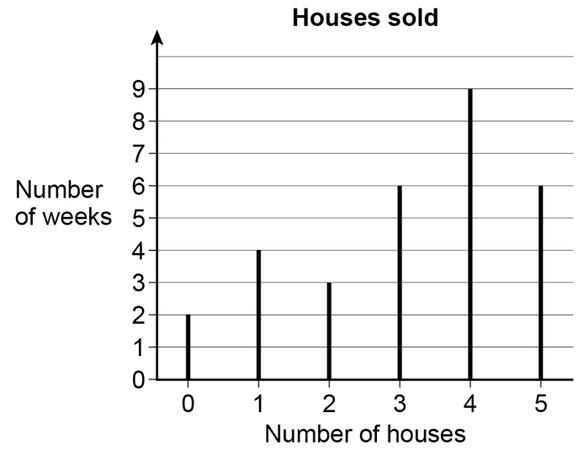
The line graph shows the number sold per week for 30 weeks.
A company sells houses.
The line graph shows the number sold per week for 30 weeks.
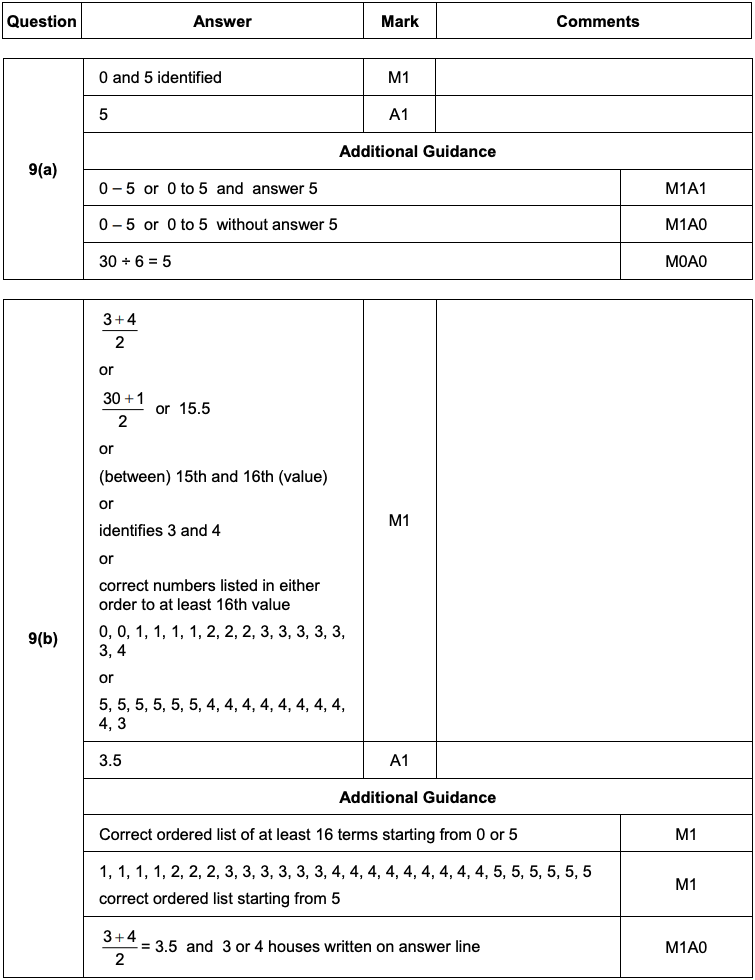
a) Work out the range of the number of houses sold per week.

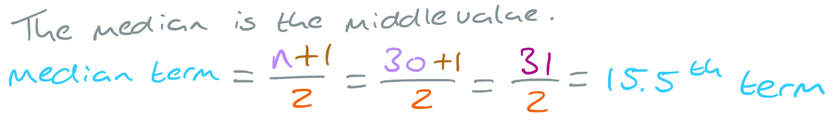
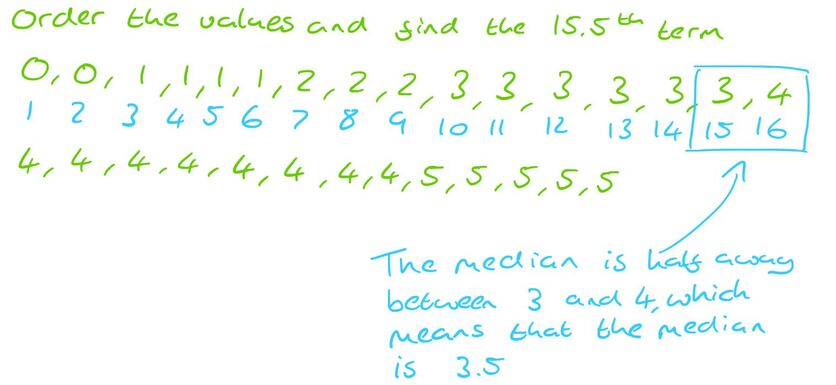
b) Work out the median number of houses sold per week.
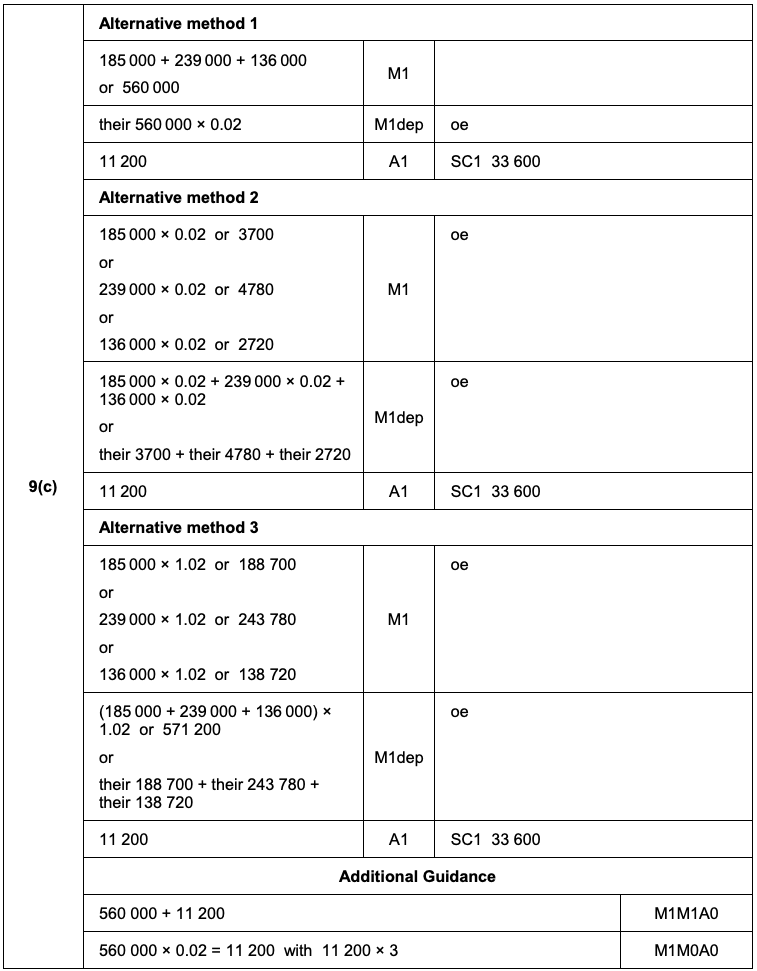
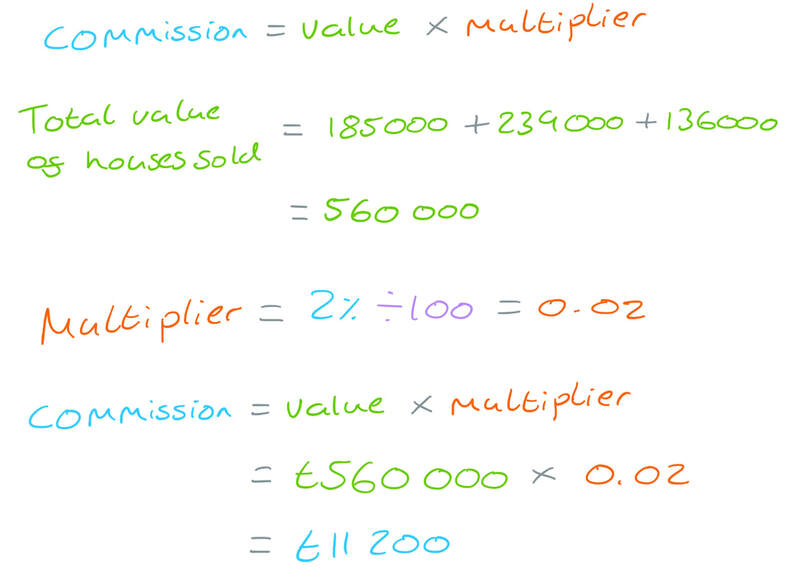
c) The company sells three houses.
The prices are £185 000, £239 000 and £136 000
The company earns 2% commission on each house.
In total, how much commission does the company earn on these three houses?
Question
Click here for a printable PDF of this question.
9)
A company sells houses.
The line graph shows the number sold per week for 30 weeks.
9)
A company sells houses.
The line graph shows the number sold per week for 30 weeks.

a) Work out the range of the number of houses sold per week.
[2 marks]
b) Work out the median number of houses sold per week.
[2 marks]
c)
The company sells three houses.
The prices are £185 000, £239 000 and £136 000
The company earns 2% commission on each house.
In total, how much commission does the company earn on these three houses?
[3 marks]