Back to AQA Maths Foundation June 2018 Paper 2 Home
Q18: Answers – Paper 2 – June 2018
Q18: Answers – Paper 2 – June 2018
Helpful Links
Mark Scheme
Working
A shop sells raincoats and umbrellas.
The scatter graph shows the monthly sales for 12 months.
A shop sells raincoats and umbrellas.
The scatter graph shows the monthly sales for 12 months.

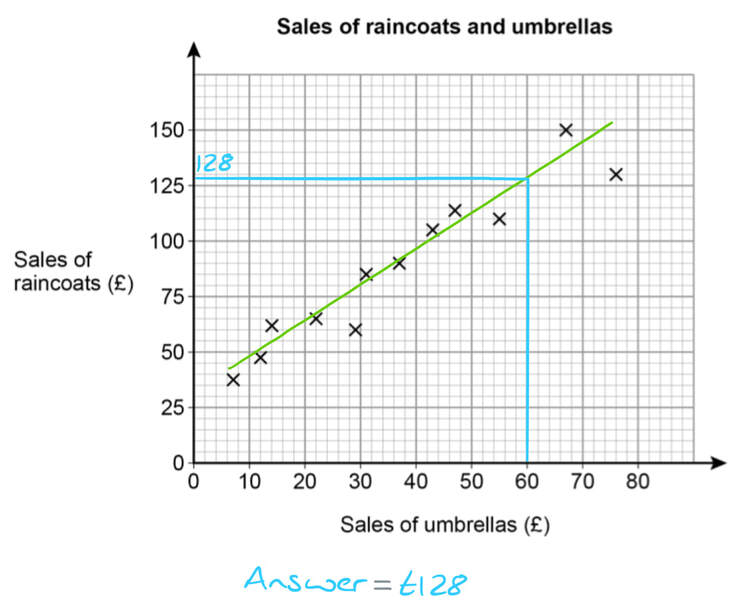
a) Write down the type of correlation shown by the graph.

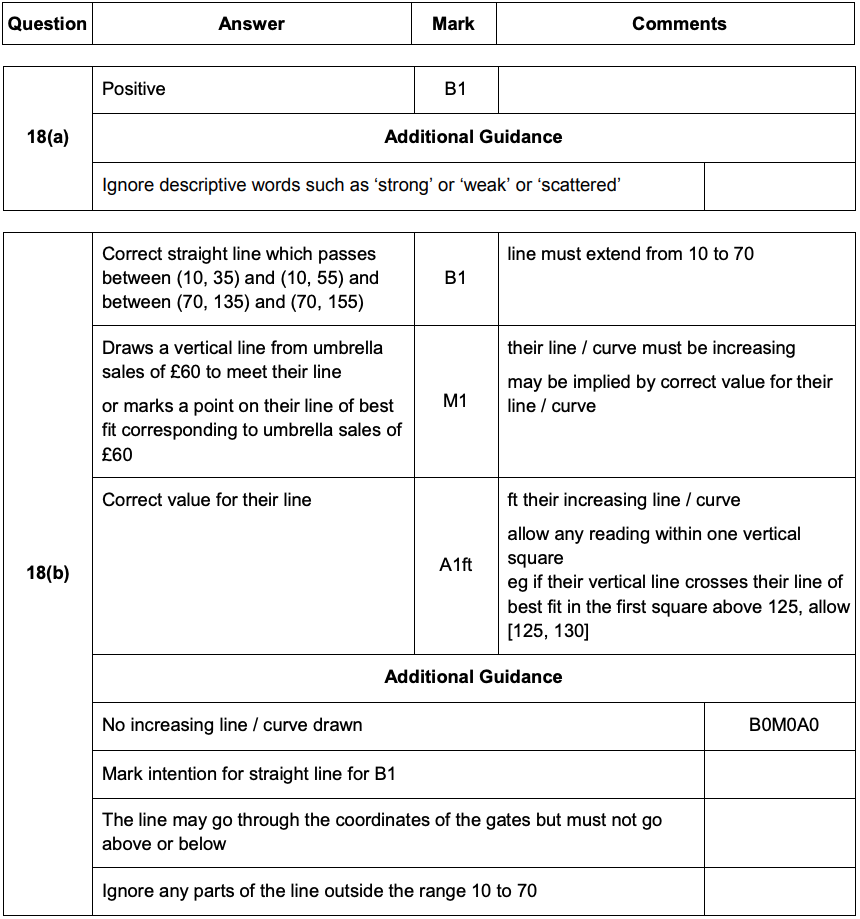
b) The manager expects the sales of umbrellas next month to be £60
Draw a line of best fit to estimate the sales of raincoats next month.
Question
Click here for a printable PDF of this question.
18)
A shop sells raincoats and umbrellas.
The scatter graph shows the monthly sales for 12 months.
18)
A shop sells raincoats and umbrellas.
The scatter graph shows the monthly sales for 12 months.
a) Write down the type of correlation shown by the graph.
[1 mark]
b) The manager expects the sales of umbrellas next month to be £60
Draw a line of best fit to estimate the sales of raincoats next month.
[3 marks]