Back to AQA Maths Foundation June 2018 Paper 2 Home
Q18: Question – Paper 2 – June 2018
Q18: Question – Paper 2 – June 2018
Helpful Links
Question
Click here for a printable PDF of this question.
18)
A shop sells raincoats and umbrellas.
The scatter graph shows the monthly sales for 12 months.
18)
A shop sells raincoats and umbrellas.
The scatter graph shows the monthly sales for 12 months.
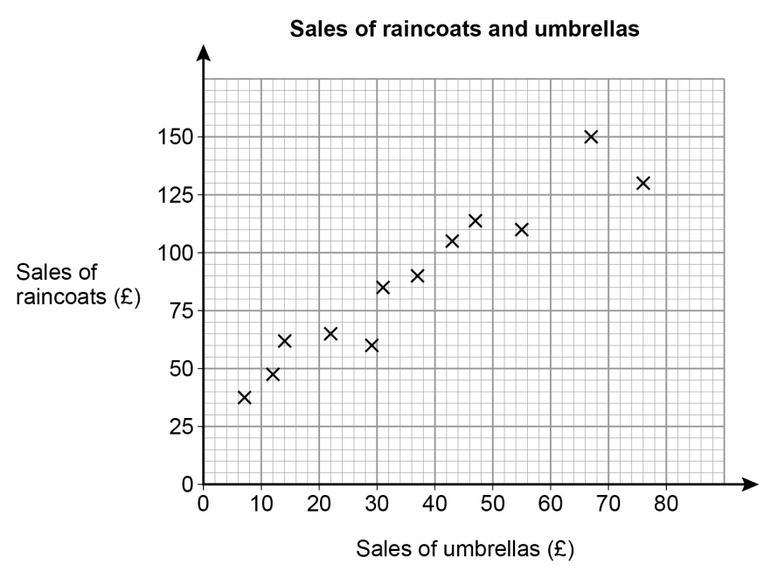
a) Write down the type of correlation shown by the graph.
[1 mark]
b) The manager expects the sales of umbrellas next month to be £60
Draw a line of best fit to estimate the sales of raincoats next month.
[3 marks]