Back to Edexcel Maths Higher November 2017 Paper 3 Home
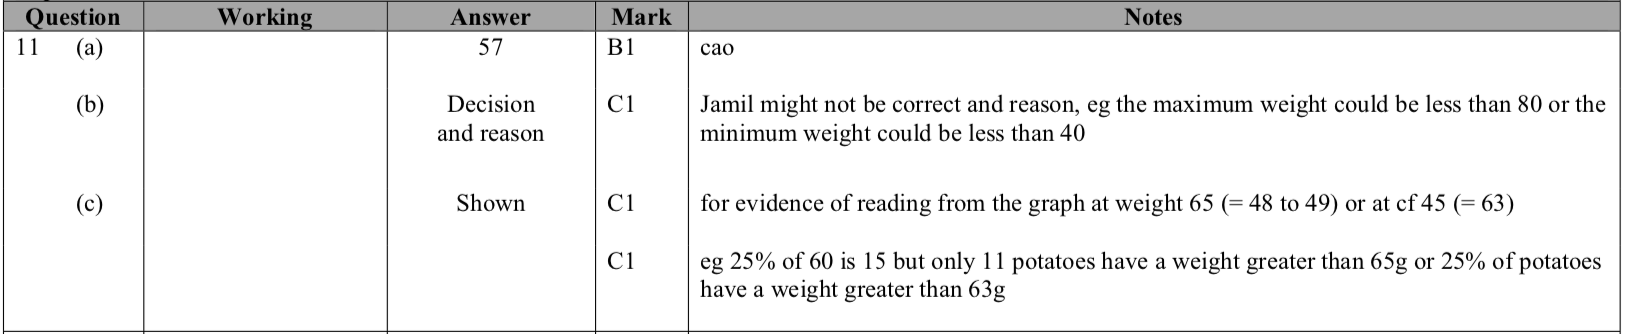
Q11: Answers – Paper 3 – November 2017
Q11: Answers – Paper 3 – November 2017
Helpful Links
Mark Scheme
Working
The cumulative frequency graph shows information about the weights of 60 potatoes.
a) Use the graph to find an estimate for the median weight.
a) Use the graph to find an estimate for the median weight.


Jamil says,
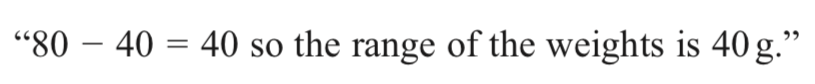
b) Is Jamil correct?
You must give a reason for your answer.
See the mark scheme for answers to part b!
c) Show that less than 25% of the potatoes have a weight greater than 65 g.
You must give a reason for your answer.
See the mark scheme for answers to part b!
c) Show that less than 25% of the potatoes have a weight greater than 65 g.


Question
Click here for a printable version of this question.
11)
The cumulative frequency graph shows information about the weights of 60 potatoes.
11)
The cumulative frequency graph shows information about the weights of 60 potatoes.

a) Use the graph to find an estimate for the median weight.
[1 mark]
Jamil says,

b) Is Jamil correct?
You must give a reason for your answer.
You must give a reason for your answer.
[1 mark]
c) Show that less than 25% of the potatoes have a weight greater than 65 g.
[2 marks]