Back to OCR Maths Higher June 2018 Paper 6 Home
Q8: Answers – Paper 6 – June 2018
Q8: Answers – Paper 6 – June 2018
Helpful Links
Mark Scheme
Working
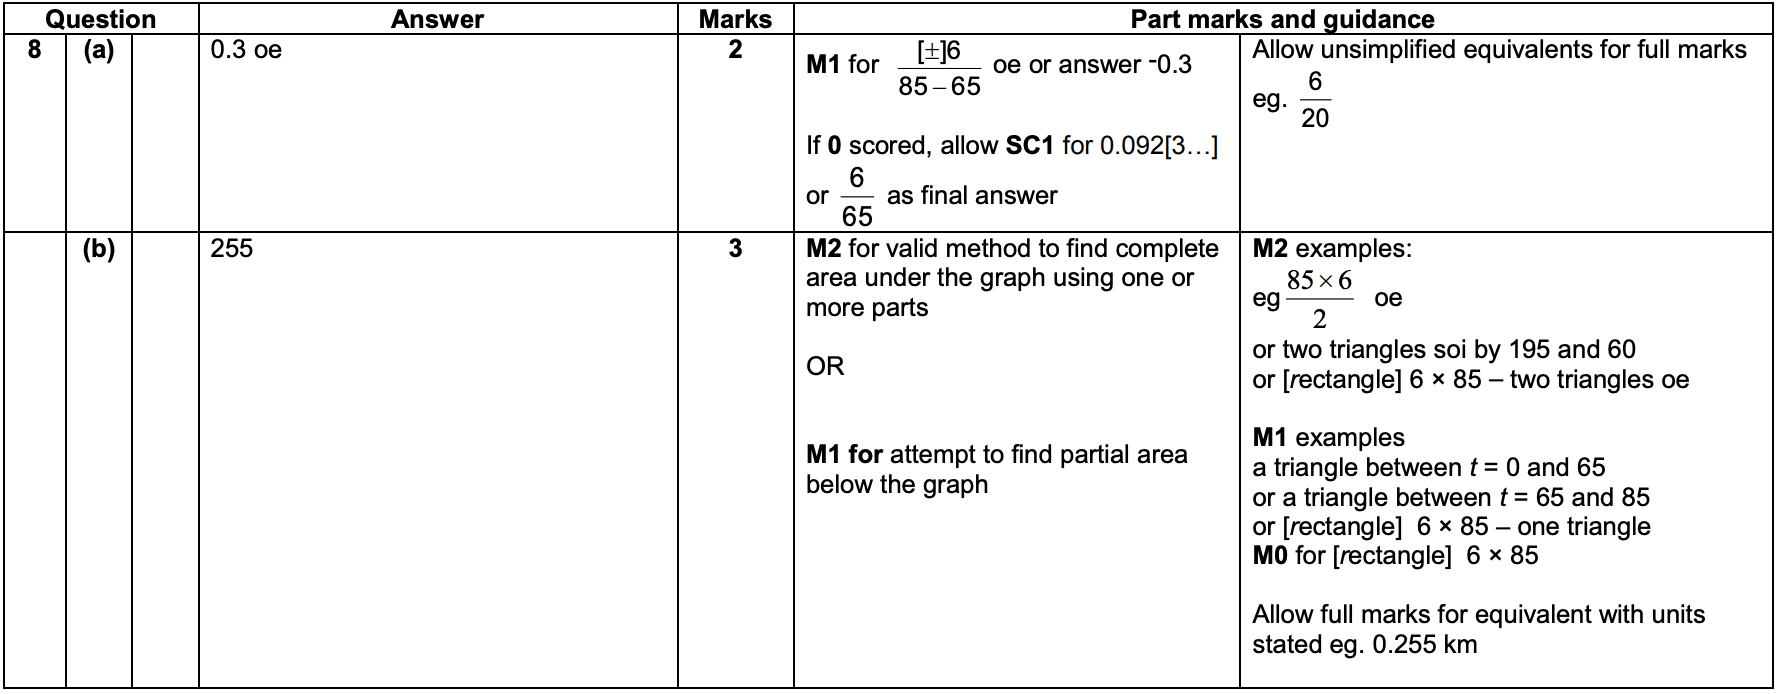
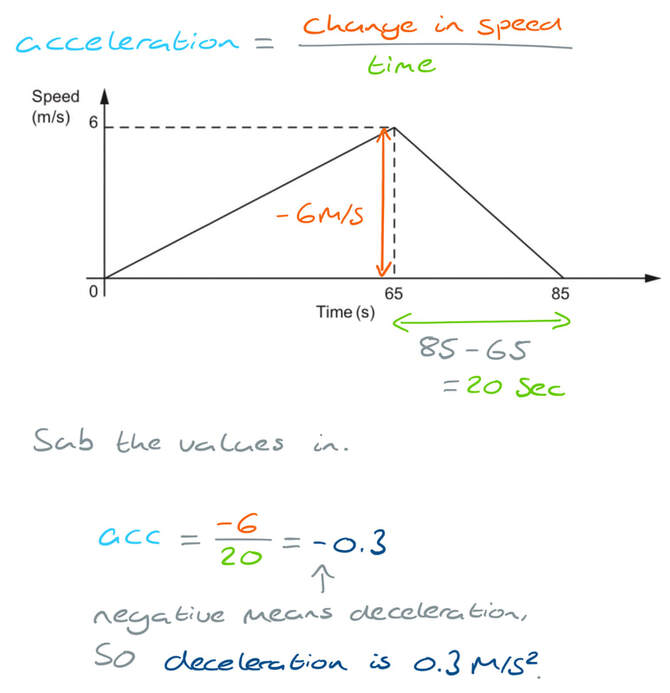
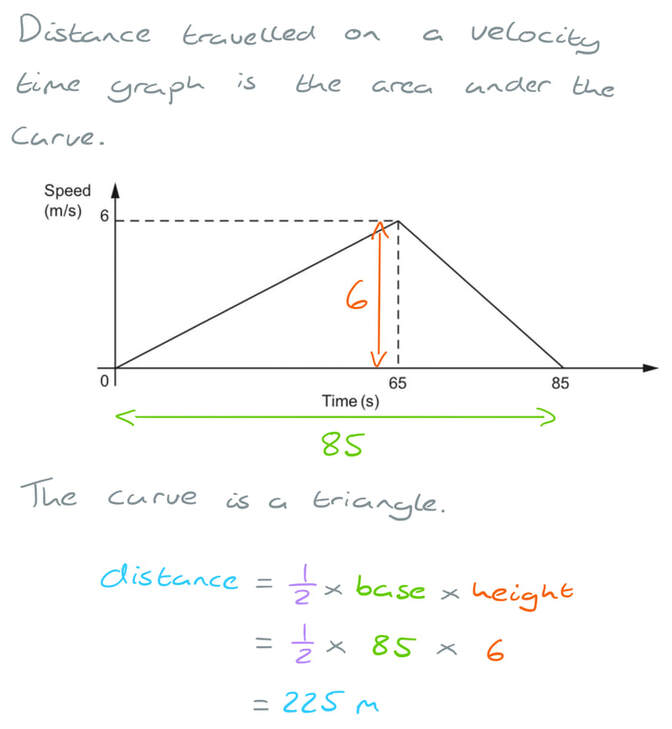
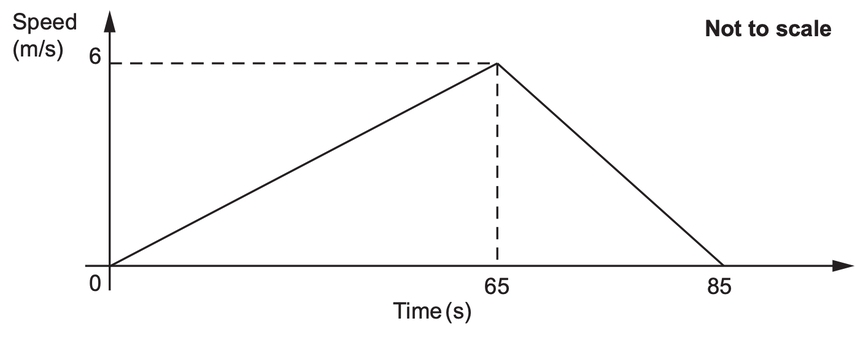
The graph shows the speed of a tram as it travels from the library to the town hall.
a) Calculate the deceleration of the tram as it approaches the town hall.
The graph shows the speed of a tram as it travels from the library to the town hall.
a) Calculate the deceleration of the tram as it approaches the town hall.
b) Calculate the distance travelled by the tram between the library and the town hall.
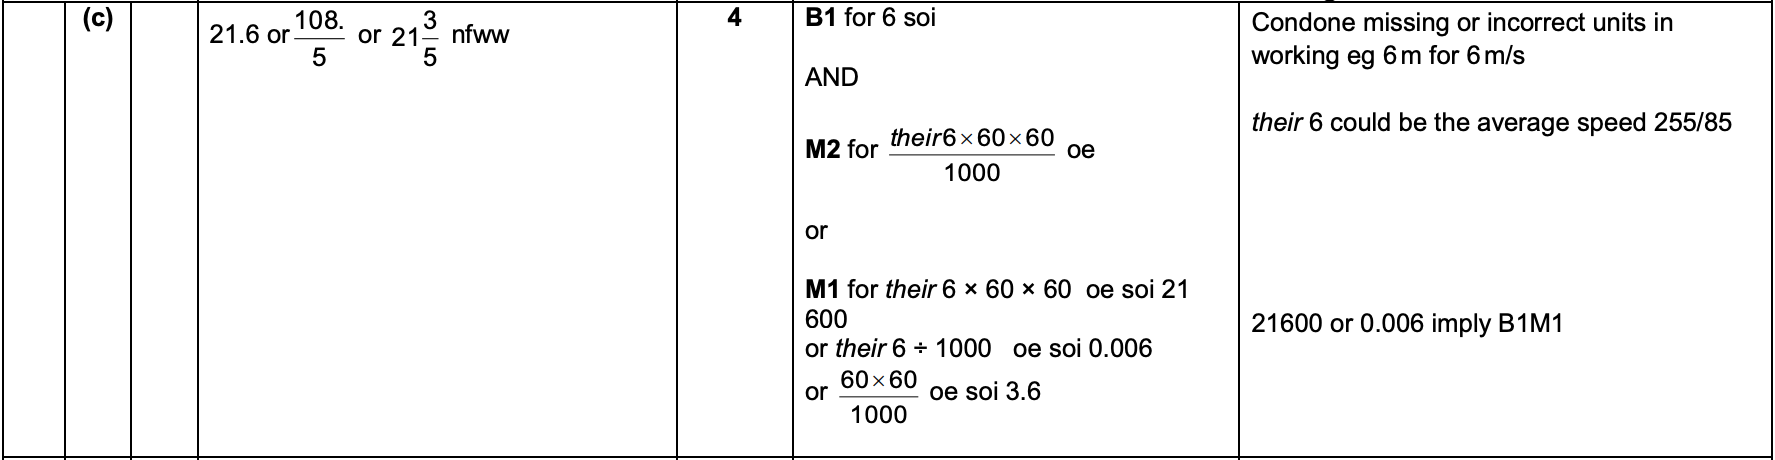
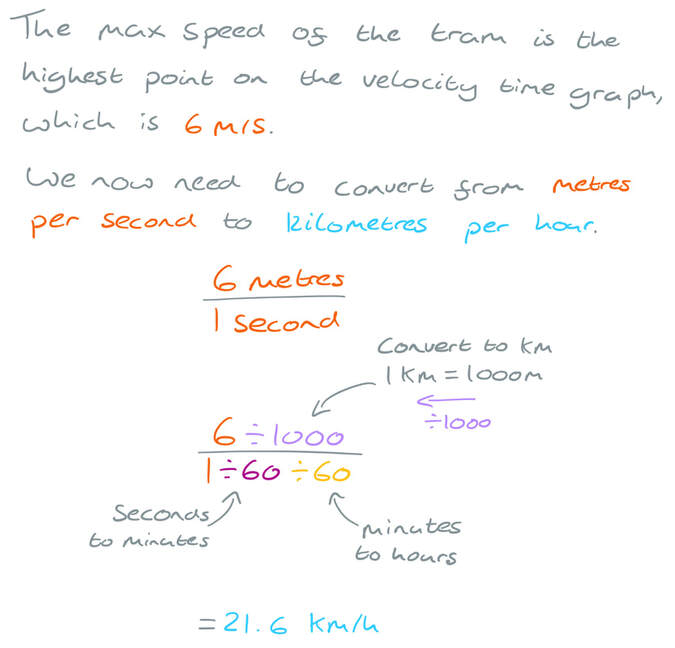
c) What was the maximum speed of the tram as it travelled between the library and the town hall?
Give your answer in kilometres per hour.
Question
8) The graph shows the speed of a tram as it travels from the library to the town hall.
a) Calculate the deceleration of the tram as it approaches the town hall.
[2 marks]
b) Calculate the distance travelled by the tram between the library and the town hall.
[3 marks]
c) What was the maximum speed of the tram as it travelled between the library and the town hall?
Give your answer in kilometres per hour.
[4 marks]