Back to OCR Maths Higher June 2018 Paper 6 Home
Q8: Question – Paper 6 – June 2018
Q8: Question – Paper 6 – June 2018
Helpful Links
Question
8) The graph shows the speed of a tram as it travels from the library to the town hall.
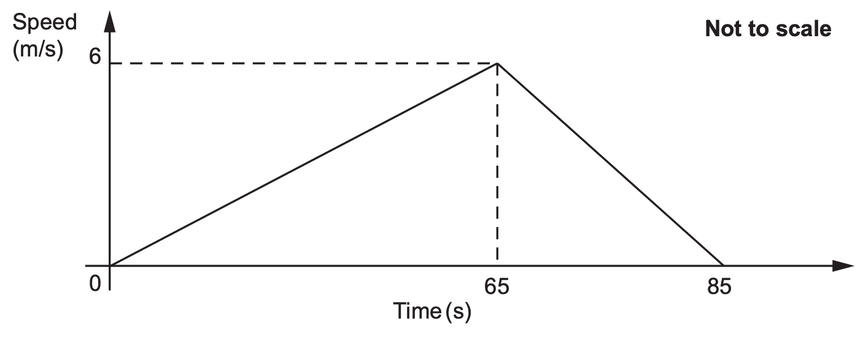
a) Calculate the deceleration of the tram as it approaches the town hall.
[2 marks]
b) Calculate the distance travelled by the tram between the library and the town hall.
[3 marks]
c) What was the maximum speed of the tram as it travelled between the library and the town hall?
Give your answer in kilometres per hour.
[4 marks]