Paper 2 Higher - Sample Assessment Q19 Answers
19) The graph of y = f(x) is shown on both grids below.
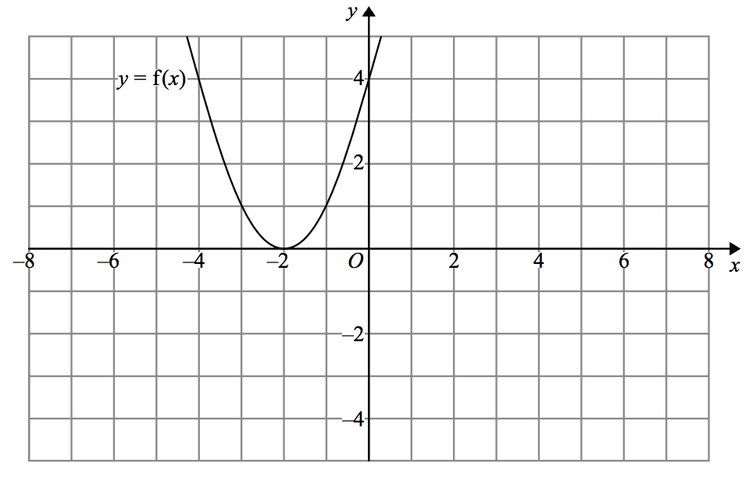
(a) On the grid above, sketch the graph of y = f(–x)
(1 mark)
(1 mark)
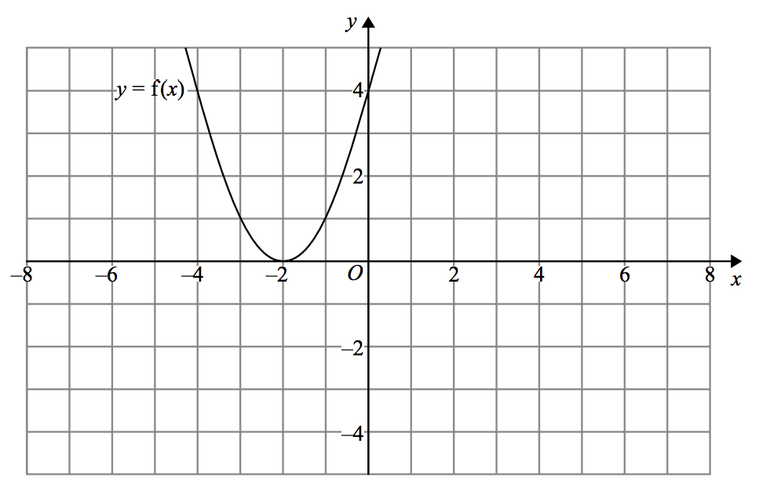
(b) On this grid, sketch the graph of y = –f(x) + 3
(1 mark)
(Total for Question 19 is 2 marks)
(1 mark)
(Total for Question 19 is 2 marks)
Answers
Question |
Answer |
Notes |
19 a |
Sketch |
P1 - Parabola passes through all three of the points (0, 4), (2, 0), (4, 4) |
19 b |
Sketch |
P1 - Parabola passes through all three of the points (−4, −1), (−2, 2), (0, −1) |