Back to Edexcel Maths Higher June 2019 Paper 2 Home
Q11: Question – Paper 2 – June 2019
Q11: Question – Paper 2 – June 2019
Helpful Links
Question
Click here for a printable version of this question.
11)
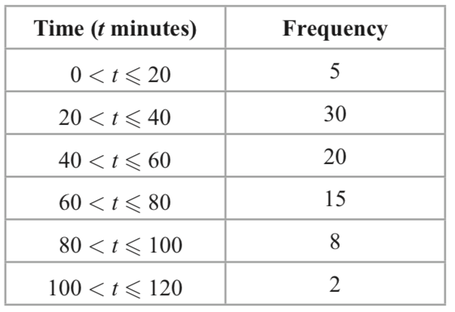
The grouped frequency table gives information about the times, in minutes, that 80 office workers take to get to work.
11)
The grouped frequency table gives information about the times, in minutes, that 80 office workers take to get to work.
a) Complete the cumulative frequency table.
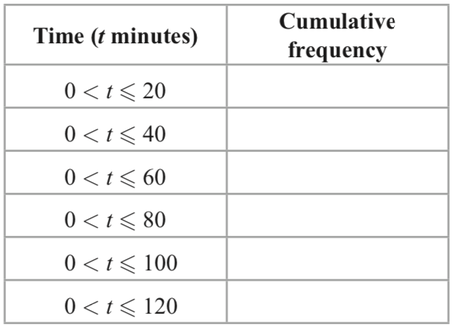
[1 mark]
b) On the grid, draw the cumulative frequency graph for this information.
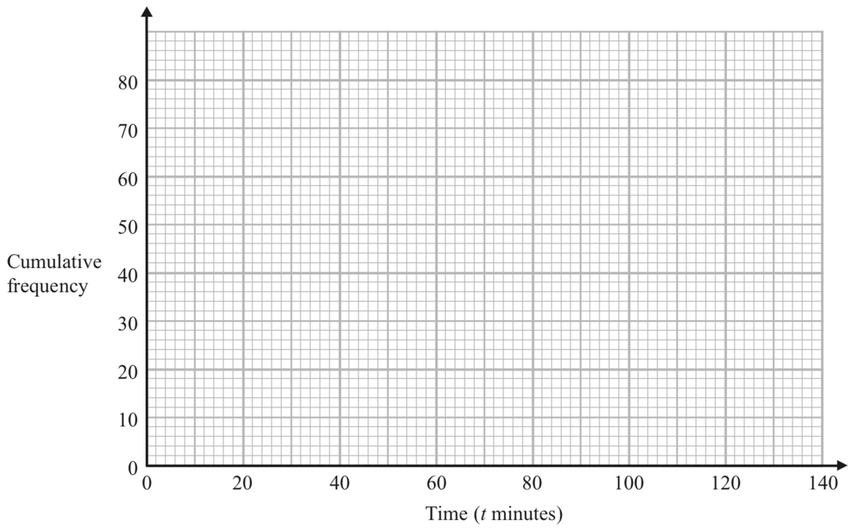
[2 marks]
c) Use your graph to find an estimate for the percentage of these office workers who take more than 90 minutes to get to work.
[3 marks]