Back to AQA Maths Higher November 2017 Paper 1 Home
Q22: Question – Paper 1 – November 2017
Q22: Question – Paper 1 – November 2017
Helpful Links
Question
Click here for a printable version of this question.
22)
Here is some information about the miles per gallon of 60 cars.
22)
Here is some information about the miles per gallon of 60 cars.
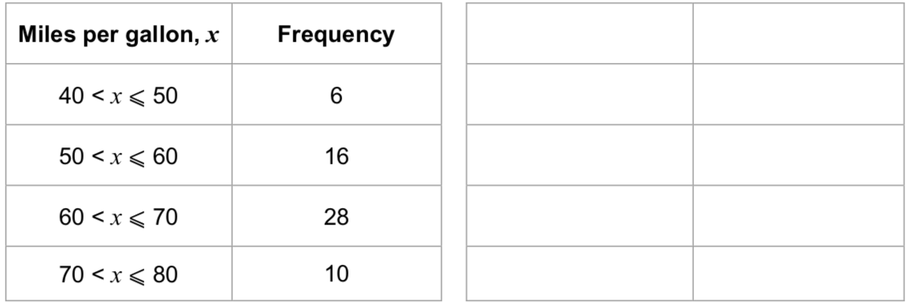
a) Draw a cumulative frequency graph.
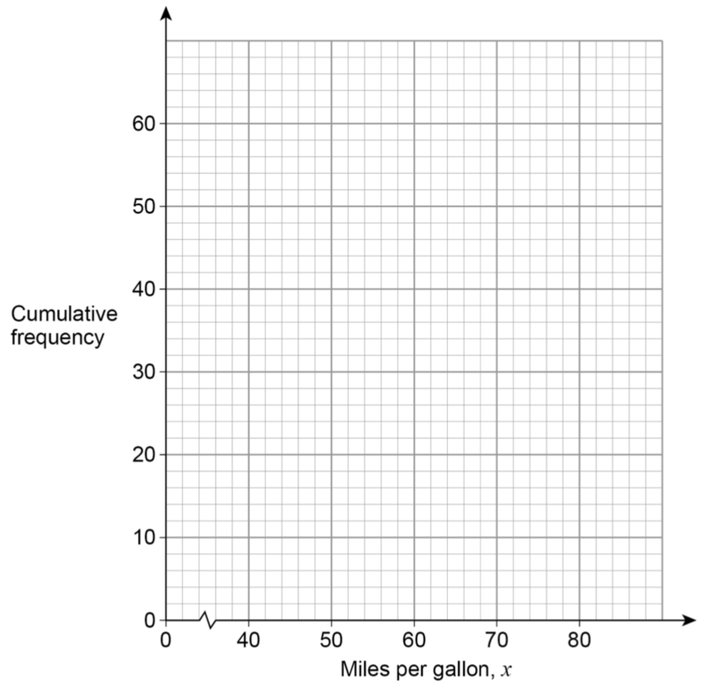
[3 marks]
b) Use the graph to work out the interquartile range.
[2 marks]